THE GOLD SECTOR! November 17, 2004.
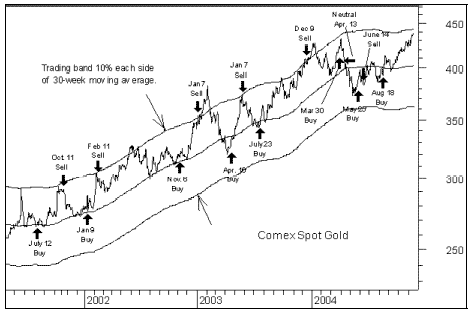
Our indicators remain on the buy signal of August 18 for the gold sector.
Closing yesterday at $438.60 an ounce, and up another $2.70 in early trading this morning(at least at the
moment), at $442.50, gold has just about reached our upside target for this rally, whichwas to the upper limit
of the trading band around its 30-week m.a., which has pretty well confined gold foryears.

Reaching an upside target is not a sell signal, but it does tell us to be watchful of ourtechnical indicators.
Having reached the upper limit of the trading band, gold could continue to slide up therising upper limit line
as it did for several months late last year. Or it could break out of the trading band tothe upside for a final
spike-up, as it did in early 2003. Or it could hit the resistance at the upper limit ofthe trading band and
immediately head south.
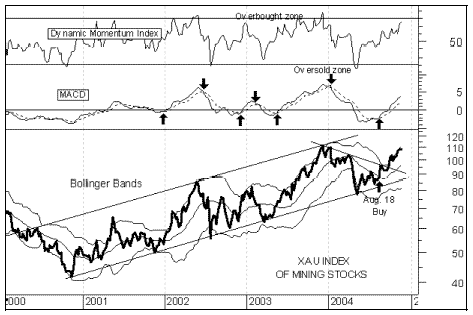
XAU Index of Mining Stocks.
After four failed attempts since last March, the XAU finally broke above its 20-week m.a.in August, and
remains there, in the usually bullish upper half of Bollinger Bands. The XAU alsocontinues in a pattern of
higher highs and higher lows since rallying off the long-term trendline support (the lowerrising blue line).
So that you would not be shaken out by the down days, for several weeks we have beenwarning that the
XAU had spiked fairly well above its 20-week m.a. (the centerline around which BollingerBands are
calculated), and was liable to become choppy as it allows the m.a. to catch up. And thathas certainly been the
case, with the XAU experiencing some dramatic down days, but then rallying again to makenew closing
weekly highs.

The intermediate-term technical indicators have not yet reached overbought levels usuallyachieved before
rallies top out, but some short-term indicators (not shown) are in overbought territory,and the XAU is
approaching the potential resistance at its 2003 peak of 113. So further reasons to bewatching closely. Yet we
have to be careful not to be shaken out by the down-days that are liable to be part ofcontinuing volatility in
the sector.
Gold received a piece of supportive news this week in the surprise jump in inflation asmeasured by the
Producer Price Index. It surged up 1.7% in October, its fastest monthly rate in 14 years.Inflation based on the
PPI has now run at 4.4% over the last 12 months, a considerable increase over the 1.5%levels when inflation
(and interest rates) were at 40 year lows a couple of years ago. The increase in the PPIpretty well guarantees
the Fed will have to continue raising interest rates.
The U.S. Dollar.
Overall, the dollar continues its dizzying decline of the last 4 years. And gold continuesto move opposite to
the dollar. Gold's rallies take place when the dollar is declining, and gold's pull-backstake place when the
dollar manages to stage a rally of several months duration.
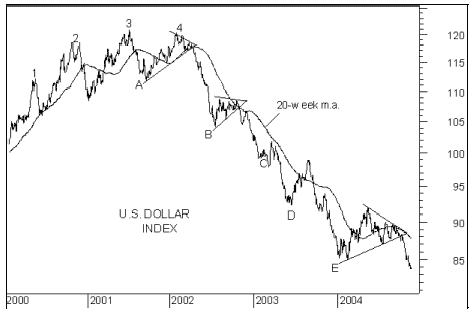
We use the following chart of the U.S. Dollar Index as one of our tools in determining thedirection of gold.
The index's 20-week moving average tends to act as a powerful magnet for the index. Whenthe dollar is in a
bull market, but periodically becomes over-extended above its 20-week movingaverage, as at 1, 2, 3, and 4
in the following chart, the m.a. pulls the dollar back down. When the dollar is in a bearmarket, as it has been
for the last four years, the U.S. Dollar Index periodically becomes oversold(over-extended beneath its
20-week m.a)., as at A, B, C, D, and E in the chart. It then tends to rally back up to atleast retest the overhead
resistance at the m.a. The dollar index then either fails at the m.a., and immediatelyresumes the decline, or
enters a pattern of lower highs and lower lows, and eventually breaks out of the triangleto the downside, to
resume its decline.

As it relates to gold, pullbacks in gold (even as its new long-term bull market continues)tend to take place
once the dollar index becomes oversold beneath its 20-week m.a., and then begins to rallyback up to the m.a.
The dollar's most recent breakdown out of a triangular pattern resulted in new multi-yearlows for the dollar
(and new multi-year highs for gold). But the dollar index is beginning to become oversoldbeneath the m.a.
again. However, the m.a. has rolled over and begun to decline more steeply. So the dollarcould just continue
down with the m.a. keeping pace, as in mid-2002, and late 2003, and not become any moreover-extended
beneath its m.a. But seeing the Index well beneath the m.a. again is another reason thatwe need to begin
watching our gold indicators closely.
CRB Index of Commodity Prices.
As we have been saying for a couple of years, we believe that, despite what thegovernment's hoky PPI and
CPI inflation gauges show, we are in a period of rising inflation. And rising inflation isa positive for gold. But
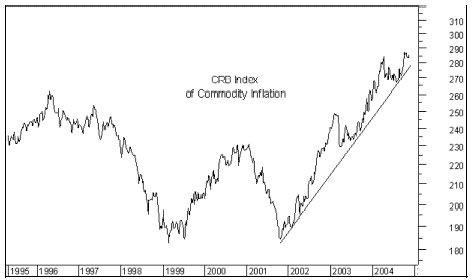
we use the CRB Index of Commodity Inflation as a better gauge of inflation as far as goldis concerned.
The chart below does show that there was a topping out of the CRB beginning at the firstof the year, and like
the rally in the dollar, that decline in the CRB coincided with the decline in the goldsector earlier in the year.
But as also shown in the chart, the CRB did not break below its rising trendline that hasbeen in place since
2001, and in August began rising again off that trendline support. And sure enough goldbegan to rally again,
and has reached new multi-year highs.

Putting it all together, we remain on our latest buy signal for gold, but recognize thatthe long-term bull market
for gold may be interrupted at any time by another intermediate-term pullback.
A new long-term target: Gold reached our upside target for 2004 of $440 an ounce. We arelooking for gold
to rise above $500 an ounce in 2005. But it won't be in a straight line up.
Long-term support for gold should continue to come from rising inflation, dollar weakness,and gold's
attraction as a safe haven in times of international uncertainties, all factors that arenot liable to go away any
time soon.
Sy Harding is president of Asset Management Research Corp., publisher of The StreetSmart Report Online at www.StreetSmartReport.com, and author of 1999'sRiding the Bear - How to Prosper in the Coming Bear Market.
NOTE: These reports express our opinions and suggestions, provided only as asupplement to your own further research and decisions. We take care to assure accuracy ofcontents but accuracy is not guaranteed. Past performance does not imply future results.
Copyright © Asset Management Research Corp. -- ALL RIGHTS RESERVED.


