Jump to content


Photo

STMo Sell Signal @ ES 1188...


  • Please log in to reply
8 replies to this topic

#1 tsharp

tsharp

    Member

  • Traders-Talk User
  • 1,487 posts

Posted 07 December 2004 - 02:21 PM

fwiw, it appears that the ES just broke down out of a smaller diamond formation...

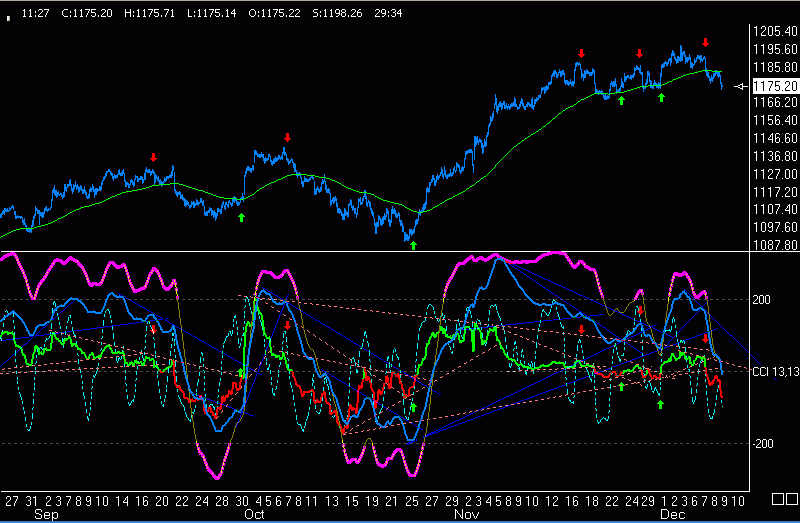
this also caused a shorter-term swing system i developed during my time away give a SAR @ 1188 about an hour ago...

STMo = Short Term Momentum

since last august the signals have been as follows:

Signal 1- Aug 13, 14:00, Buy 1064.0 ES...
Signal 2- Sept 17, 16:00, Sell 1128.0 ES... +64.0 points...
Signal 3- Sept 30, 14:00, Buy 1112.0 ES... +16.0 points...
Signal 4- Oct 7, 11:30, Sell 1136.0 ES... +24.0 points...
Signal 5- Oct 25, 16:00, Buy 1095.0 ES... +41.0 points...
Signal 6- Nov 17, 15:20, Sell 1181.0 ES... +86.0 points...
Signal 7- Nov 23, 14:00, Buy 1174.0 ES... +7.0 points...
Signal 8- Nov 29, 10:00, Sell 1185.0 ES... +11.0 points...
Signal 9- Dec 1, 10:00, Buy 1178.0 ES +7.0 points...
Signal 10- Dec 7, 13:00, Sell 1188.0 ES +10.0 points...

charts to follow with most recent first (reverse order):

Posted Image

Posted Image

Posted Image

Posted Image

Posted Image

Posted Image

#2 deacon

deacon

    Member

  • Traders-Talk User
  • 563 posts

Posted 07 December 2004 - 02:38 PM

you got the 7 down to the ES 20DMA nicely :) dow 20 day ema 10462 TXN mid qtr update tonite... late tech stock buyers should defend if they get a chance from TXN... the market dove today after CSCO revealed they were not raising targets, headlines i got were during lunch hour big apple time

#3 tsharp

tsharp

    Member

  • Traders-Talk User
  • 1,487 posts

Posted 07 December 2004 - 02:48 PM

you got the 7 down to the ES 20DMA nicely  :)

dow 20 day ema 10462

TXN mid qtr update tonite... late tech stock buyers should defend if they get a chance from TXN... the market dove today after CSCO revealed they were not raising targets, headlines i got were during lunch hour big apple time

<{POST_SNAPBACK}>


thanks, deacon...

i do my forecasting from daily and weekly charts, but don't have the guts or deep enough pockets to trade at that level... besides the first ten months of this year were essentially flat, so the smaller swings truly ruled.

--tsharp

#4 deacon

deacon

    Member

  • Traders-Talk User
  • 563 posts

Posted 07 December 2004 - 03:09 PM

wow better selling of the tech stocks after consumer credit came out! the Federal Reserve just reported an October Consumer Credit reading of 7.7 bln, which came in much higher than the $6.0 bln economists had anticipated, and an adjusted figure for last month of $13.6 bln versus a prior reading of $9.8 bln C has an analyst meeting tomorrow, with the financials such a big % of SPX now(>20%) it would be something if they begin selling hard MRK has a mid qtr update tomorrow

#5 deacon

deacon

    Member

  • Traders-Talk User
  • 563 posts

Posted 08 December 2004 - 01:33 PM

weekly pivots Es = 1187 compx=2134 CURRENT McC OSC: -146.166 PRIOR McC OSC: -49.558 NYSE DATA FOR 12/07/04 a one day wonder again, which has been the pattern since bush reelection...? mcclellan osc got oversold enough in a hurry, and financials supported well by today's bond spike

#6 tsharp

tsharp

    Member

  • Traders-Talk User
  • 1,487 posts

Posted 08 December 2004 - 03:08 PM

weekly pivots Es = 1187  compx=2134

CURRENT McC OSC:    -146.166
PRIOR McC OSC:      -49.558    NYSE DATA FOR    12/07/04

a one day wonder again, which has been the pattern since bush reelection...?

mcclellan osc got oversold enough in a hurry, and financials supported well by today's bond spike

<{POST_SNAPBACK}>


the main engine of this swing system is the hybrid momentum indicator i developed while away, so while other indicators may suggest the drop was but a one day wonder, it may well end up being such, my signal is still on a sell... though admittedly, this system it's not designed to accel in the relatively choppy market-climate we've seen over the past several weeks.


--tsharp

#7 deacon

deacon

    Member

  • Traders-Talk User
  • 563 posts

Posted 08 December 2004 - 03:33 PM

as soon as i posted it dropped ever since... the dow 10500 mega 1/2k rounderrr stopped it cold 2117 compx was a previous 10month high XAU perfect drop off the touch of that 50% of 41-155 and also early november low awhile ago... open gap above em

#8 tsharp

tsharp

    Member

  • Traders-Talk User
  • 1,487 posts

Posted 09 December 2004 - 11:10 AM

as soon as i posted it dropped ever since... the dow 10500 mega 1/2k rounderrr stopped it cold

2117 compx was a previous 10month high

XAU perfect drop off the touch of that 50% of 41-155 and also early november low awhile ago... open gap above em

<{POST_SNAPBACK}>


hey deac,

in as much as i can, i attempt to keep my forecasting work separate from my trading systems work... that said, i've found that it's best not to try to predetermine where the market will go on any particular swing, but to just let the system do the driving for you... that's why it was created; right?

anyway, it's still short, and the blue indicator has now also entered negative territory... i reckon that if we're gonna see a potential bounce, it would be as a result of the blue bouncing from these levels, it's also noted that the diamond formation i mentioned above has now reached its targeted range... but as always, twt.

current chart is attached.


--tsharp

Attached Thumbnails

  • STMoSwing_12_09_04.gif


#9 Lynnezhu

Lynnezhu

    Member

  • Traders-Talk User
  • 120 posts

Posted 09 December 2004 - 03:26 PM

maximum targeted range up or down. (sorry to be so elementary). Thanks. Lynnezhu :blink: