S&P 500 CASH
SPX CASH: Daily Projected Support andResistance levels: High - 1187; Low - 1179
DEC SP:
SPX CASH:
DEC SP:
SPX CASH: Monthly Projected Support and Resistance levels: High - 1211; Low - 1150
SPX CASH: Yearly Projected Support and Resistance levels: High - 1274; Low - 950
Current SPX Index Positions:
Mid-term (6-8 weeks) = 25% BULLISH from 1182.62
Short-term (1 day-3 weeks) = 50% BULLISH from 1183.89
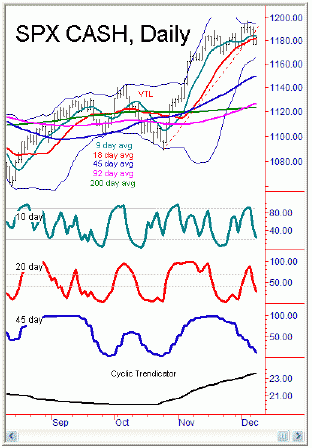
From previous outlook: "the SPX proceeded to close below the red dashed VTLline on the daily chart. . . This action gives us the best-odds we have that the downphases of the 45 and 90 day cycles are in effect, and a 3-5% drop off the highs is inprogress here. Volume today came in at 1.52 billion shares, which is about a 10% increasefrom Monday’s numbers; seeing that a lower swing low was registered, this also givesabove-average odds that a lower low will be seen in Wednesday’s session as well.Also, note from our daily chart that both the 10 and 20 day oscillators are now headedsouth, which is probably a secondary confirmation to all of the above. If the December 6
Current analysis: The SPX registered a new swing low in today’s session, tagging1176.80 at the intraday bottom. From there, the 36 hour cycle turned up and told us a testof 1184-1185 SPX CASH would likely be seen on the turn, which was hit by midday. Thebalance of the day was spent in consolidation mode, with volume coming in again at 1.5billion shares, which is about equal with Tuesday’s figures.

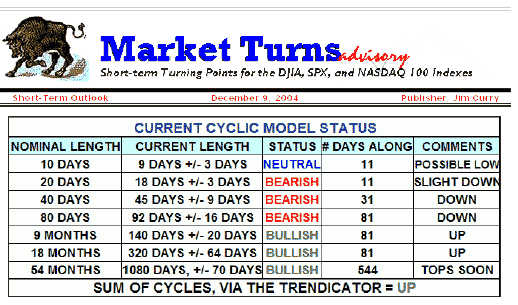
From last night: "the statistics say that the drop into the 45 and 90 daycycle bottoms should be short and quick, ideally lasting 5 days from the top or better,but also bottoming before 17 trading days off the same. The Bradley Indicator then islooking for a low on the 13th (withthe second turn on the 22nd), while the time cycles arelooking for it closer to the latter end, closer to the 21st-22
Current analysis: No change to the above notes. The 13th-22
Shorter-term then, the bounce that was seen in today’s session was the result of aturn up in the minor hourly cycles, but that should be stymied below the 1197 swing top inthe next day or so and then lead again to another drop to new swing lows for the move inthe coming days and before next Monday’s close is up. There is strong channelresistance at the 1190-1193 region, and really that should not be taken out on any bouncehere before new lows are registered. We’ll see how Thursday plays out and take a moredetailed look in tomorrow night’s outlook.
NASDAQ 100 CASH
Daily Projected Support and Resistance levels: High, 1610 - Low, 1593
5-Day Projected Support and Resistance levels: High, 1655 - Low, 1590
Monthly Projected Support and Resistance levels: High, 1640 - Low, 1525
Current NDX Index Positions:
Mid-Term (6-8 weeks) = 25% BULLISH from 1591.11
Short-term (1 day - 3 weeks) = NEUTRAL
From previous outlook:

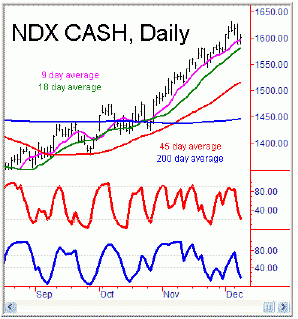
Current analysis: The NDX also made new swing lows for the week, tagging 1588.73 onthe early day drop. From there prices rose for a test of outlined first resistancefrom last night (1600-1609), tagging 1607.49 at the intraday peak. Volume here camein at 2.4 billion shares, which is about an 8% decrease from Tuesday’s session.
As per last night’s comments, this larger cycle low looks primed to be seen onor near the 13th, with an outside shot it could be seenas late as the 22nd. In terms of price, the downside magnet may be the gap left from the 1571 area from a week or two back, which mayalso act as downside support for this move lower. We have lower support at the 1525monthly projected support low, so the best guess analysis is that the next cycle low willbe made near the 13th and withinthis 1525-1570 region.
As per last night, short-term resistance is firming at the 1609 area, and should notreally take out the 1633 swing top if the larger down cycles are in charge of this marketas is currently viewed.
Email: jcurry@cycle-wave.com
Disclaimer - The financial markets are risky. Investing is risky. Past performance doesnot guarantee future performance. The foregoing has been prepared solely for informationalpurposes and is not a solicitation, or an offer to buy or sell any security. Opinions arebased on historical research and data believed reliable, but there is no guaranteethat future results will be profitable. The methods used to form opinions are highlyprobable and as you follow them for some time you can gain confidence in them. The marketcan and will do the unexpected, use the sell stops provided to assist in risk avoidance.Not responsible for errors or omissions. Copyright 2004, Jim Curry.


