
We are going to show, with a series of charts, that severe declines in U.S. stock prices as measured by the Dow Jones Industrial Average (1915-1994) have a strong probability of occurring during a particular portion of the Synodic Period (Angular Separation in Zodiacal Longitude) between the two planets MARS and URANUS (as viewed from the Earth).
Through the Dow history, there has been a distinct pattern of Rising Prices from the Conjunction (Harmonic of One = meeting of the two planets in zodiacal longitude = zero degrees of separation) to the opposition (Harmonic of Two = 180 degree separation) and an Inverse pattern of Decl inmg Prices during the latter half of this cycle (where the separation recedes from 180 degrees and returns to zero.
More importantly, EVERY ONE OF THE MAJOR VOLATILE BEAR MARKETS SINCE 1920 TOOK PLACE IN THE LATTER HALF (RECEDING PORTION) OF THE MARS/URANUS CYCLE!
While statistically, six out of six events is intuitively impressive, the number of events is too small for a high-confidence conclusion on the basis of the two-parameter coin-flip variety (up/down). The most intriguing quality is the AMOUNT OF DECLINE in the Dow Jones Industrial Average during selective cycles. We have not yet determined what if any astronomic correlates distinguish a Mars/Uranus CRASH cycle from a Normal or Random mars/Uranus cycle.
CHART #1 shows the Average Percent Change over the entire cycle length (1.924 years). This is the average DJIA at each 5 degrees separation of Mars to Uranus over 42 of these cycles since 1915. As the cycle amplitude from low to high is 6.8% on average, both directions (short on down periods) yield 7.07% per year throughout the 1915-1994 history.
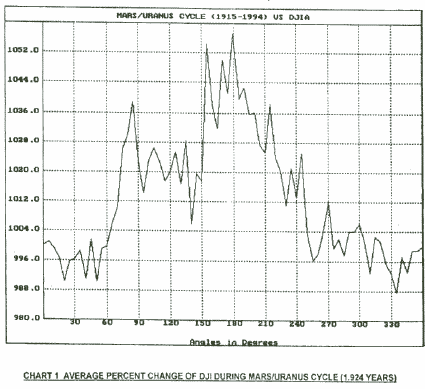
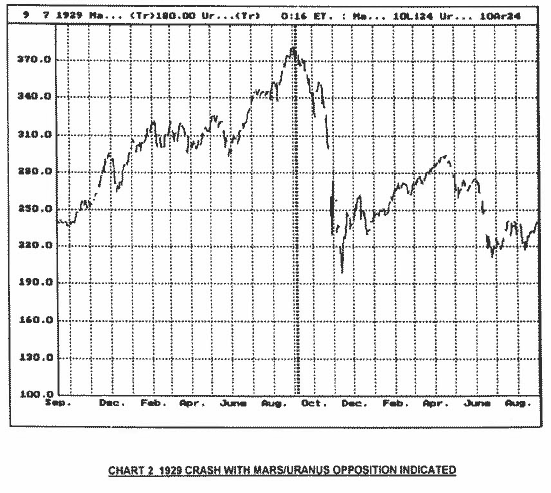
CHART #2 is, of course, the 1929 peak and crash, indicating with a dark dotted !ine the date of the Mars/Uranus Opposition (cycle top) on September 7,1929, The Actual DJIA top occurred on September 3rd. Interesting on casual examination. Remember though, that ANYTHING that happened within 4 days of that top (astronomic or not) would replicate this relationship.
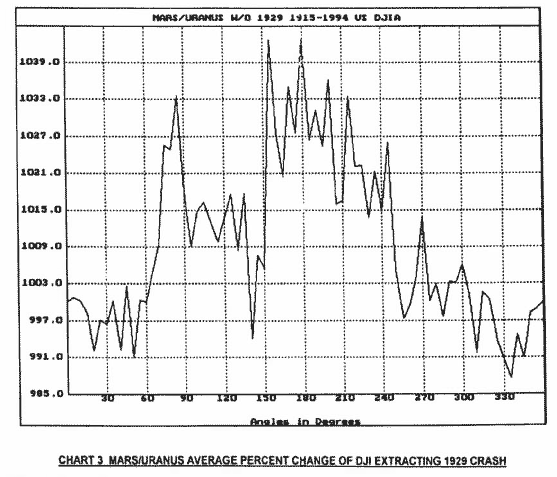
So, in CHART #3, we duplicate CHART #1 after EXTRACTING the overwhelming influence of the 1929 cycle experience. Notice that the cycle amp'itude has only reduced from 6.8% to 5.7% and the average data Maximum remains coincident with the Mars/Uranus opposition over the 41 cycles.
CHARTS #4 through #8 are self-explanatory, merely indicating where in time the MARS/URANUS Opposition took place around the greatest declines in the senior Dow Average since World War I. CHART #4 = 1937. CHART #5 = 1962, CHART #6 = 1966, CHART #7 = 1973-74 and CHART #8 =1987.
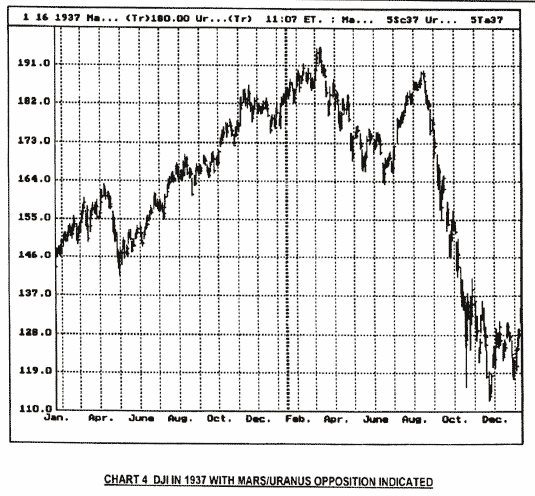
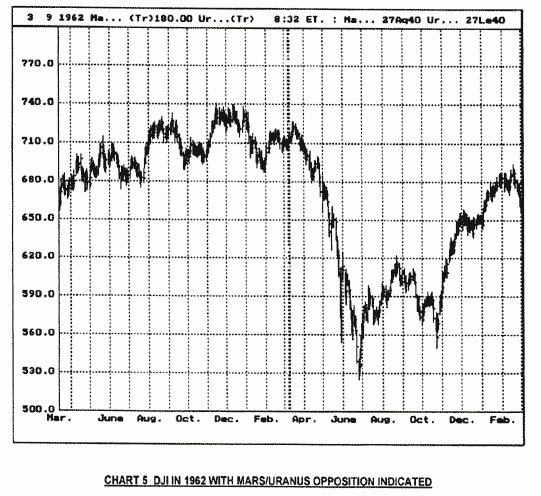
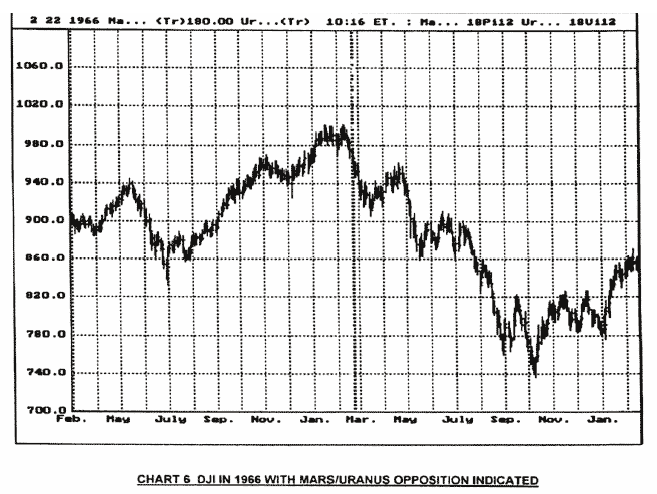
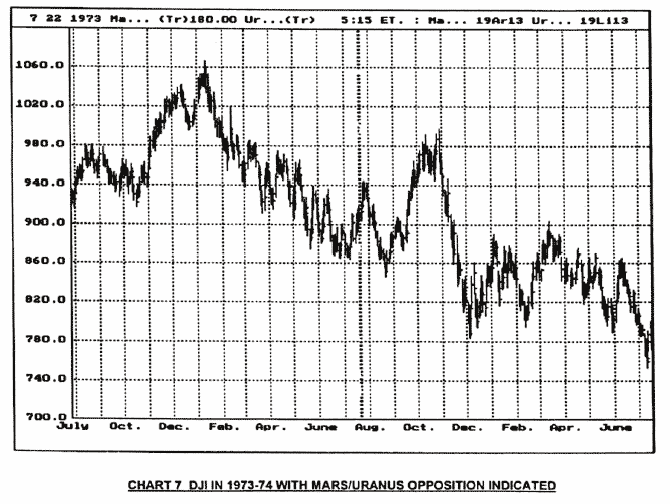
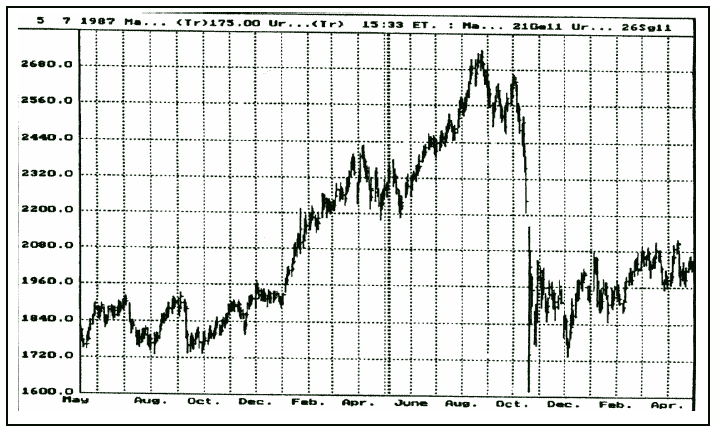
A casual inspection reveals immediately, and without the need for subtle statistical constructs, that EVERY HIGH VOLATILITY SMASH SINCE WORLD WAR I HAS OCCURRED WITHIN THE SAME 40% OF THE MARS/ URANUS SYNODIC LONGITUDINAL CYCLE, that is, in the receding half of the cycle from a separation of 180 degrees to a separation of 36 degrees prior to the next conjunct!
Periods where the "Crash" portion of this cycle are active are:
•Opposition 180
9/11/96
9/4/98
8/29/00
•36 From Conj. (324 degrees)
11/7/97
10/26/99
10/5/01
Arch Crawford
email us: info@crawfordperspectives.com
website link: www.crawfordperspectives.com
You've seen him on CNBC, Adam Smith's Money World, Nightly Business Report, Sightings, Wall St Journal Report, Good Morning America and Geraldo. He is interviewed weekly on WCIU – TV (#26) in Chicago (Mondays @ 12:20 CDT) and WJLA – TV (#57) in Los Angeles which is now available worldwide in real time (7:30AM PDT, 10:30 EDT) at www.businessnews2000.com!
Arch Crawford, editor and publisher of Crawford Perspectives for over 20 years, cut his Technical Analysis teeth as first assistant to Top Wall Street technician, Robert Farrell at Merrill Lynch (1961-64) and was said by Kiplinger's Personal Finance to be the "… only one market-timing newsletter among several dozen timers tracked by Hulbert Financial Digest (that) has outpaced the simple strategy of buying and holding…the S&P500… over the past five years."
"The Street's best known Astrologer" (according to BARRON'S) has made some astounding market calls, including "The best Bull Market in 15 years" (WSJ-1981) and the Exact Top and Crash in 1987, using a combination of technical analysis and astronomic cycles. Enough Swiss Bankers subscribe to warrant a German language edition.
Mail:
Crawford Perspectives
6890 East Sunrise Drive
Suite #120-70
Tucson, AZ 85750-0840
USA
Telephone:
(520) 577-1158
CP Newsletter = $250/year(12)
900# HOTLINE = 1-900-73-SOLAR or (737-6527)10am & 2pm Eastern Time = $4.30 per 2-3 minute call.
Many can no longer reach 900 numbers:
New 800# available which requires personal code. Must set up credit account with INFOVISION at 1-970-224-4441. Once Daily NYC phone updated at 2:20ET = $250/year
Consulting by phone & occasional Faxes/Emails = $3500/year. This will increase to $10,000/year on the first 500 point loss by DJIA!


