Jump to content


Photo

SPX


  • Please log in to reply
3 replies to this topic

#1 SilentOne

SilentOne

    Member

  • Traders-Talk User
  • 3,452 posts

Posted 28 October 2005 - 08:21 AM

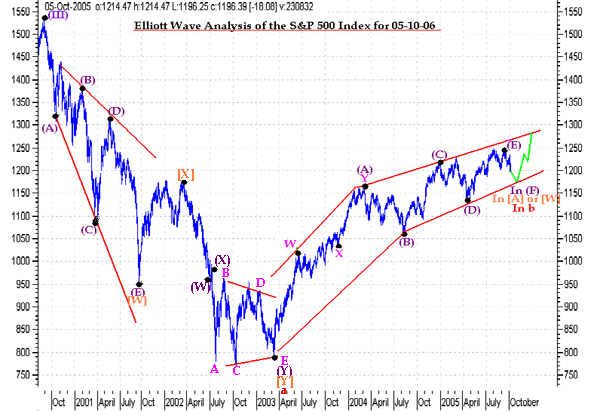
As far as ewave, I am a Frost and Prechter guy. I have not studied the Neowave stuff of Glen Neely. Here is David Petch's recent ewave take for the $SPX.

A 7-legged corrective wave sequence. And it does not include an "X" wave. OK, I'll bite.

Update of the S&P 500 Index
Posted Image

I quote David Petch:

Diametrics

I requested this information from Glenn Neely, since he discovered these formations after his book "Mastering Elliott Wave". This is verbatim:

"A diametric formation is a NEW pattern I (Glenn Neely) made in 1990- about two years after I finished Mastering Elliott Wave. As a result it is NOT mentioned in the book.

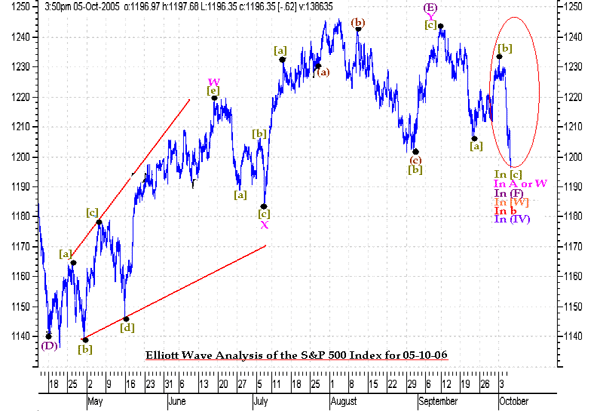
A diametric is a 7-legged formation (Triangles are 5 and Flats/Zigzags are 3) that does NOT involve an x-wave. As a result, instead of a-b-c-X-a-b-c, I had to continue with the alphabet, labeling it as a-b-c-d-e-f-g. The distinguishing factor of a Diametric is the similarity of each wave segment in time and complexity to the other six. In Flats and Zigzags, time/complexity differences are extreme between waves a, b and c. In Triangles less so, in Diametrics similarity is the rule.

In general, Diametrics appear to occur in two main categories. One, which is a period of expansion, is evident during waves a-b-c-and d, the period of contraction for waves e-f and g. or the reverse occurs. Contraction first during the first four wave segments then expansion second for the remaining three.

This creates the look of a bowtie for the first series and a diamond shape for the second."
Posted Image

If this has relevance, the "G" wave is the one to watch for. Looking at cycles, a rise now in "F" and a hair-raising drop into early Jan. would fit.

I think it is fair to say that the action in the last 18 months has been difficult for ewavers. Each time it looks like the market wants to drop heavily (like now), it bounces right back. The dianmetric, strange pattern that it is, fits this market action. Everything has been 3 waves since 2003.

Tsharp, porkloin, et al. your comments are always welcome.

cheers,

john
"By the Law of Periodical Repetition, everything which has happened once must happen again and again and again-and not capriciously, but at regular periods, and each thing in its own period, not another's, and each obeying its own law ..." - Mark Twain

#2 SilentOne

SilentOne

    Member

  • Traders-Talk User
  • 3,452 posts

Posted 28 October 2005 - 08:36 AM

If this has relevance, the "G" wave is the one to watch for. Looking at cycles, a rise now in "F" and a hair-raising drop into early Jan. would fit.


Petch has it the other way around. "G" wave up due some time soon. Can you tell I don't have a handle on this stuff?

cheers,

john
"By the Law of Periodical Repetition, everything which has happened once must happen again and again and again-and not capriciously, but at regular periods, and each thing in its own period, not another's, and each obeying its own law ..." - Mark Twain

#3 tsharp

tsharp

    Member

  • Traders-Talk User
  • 1,487 posts

Posted 28 October 2005 - 09:00 AM

As far as ewave, I am a Frost and Prechter guy. I have not studied the Neowave stuff of Glen Neely. Here is David Petch's recent ewave take for the $SPX.

A 7-legged corrective wave sequence. And it does not include an "X" wave. OK, I'll bite.

Update of the S&P 500 Index

Posted Image

I quote David Petch:

Diametrics

I requested this information from Glenn Neely, since he discovered these formations after his book "Mastering Elliott Wave". This is verbatim:

"A diametric formation is a NEW pattern I (Glenn Neely) made in 1990- about two years after I finished Mastering Elliott Wave. As a result it is NOT mentioned in the book.

A diametric is a 7-legged formation (Triangles are 5 and Flats/Zigzags are 3) that does NOT involve an x-wave. As a result, instead of a-b-c-X-a-b-c, I had to continue with the alphabet, labeling it as a-b-c-d-e-f-g. The distinguishing factor of a Diametric is the similarity of each wave segment in time and complexity to the other six. In Flats and Zigzags, time/complexity differences are extreme between waves a, b and c. In Triangles less so, in Diametrics similarity is the rule.

In general, Diametrics appear to occur in two main categories. One, which is a period of expansion, is evident during waves a-b-c-and d, the period of contraction for waves e-f and g. or the reverse occurs. Contraction first during the first four wave segments then expansion second for the remaining three.

This creates the look of a bowtie for the first series and a diamond shape for the second."

Posted Image

If this has relevance, the "G" wave is the one to watch for. Looking at cycles, a rise now in "F" and a hair-raising drop into early Jan. would fit.

I think it is fair to say that the action in the last 18 months has been difficult for ewavers. Each time it looks like the market wants to drop heavily (like now), it bounces right back. The dianmetric, strange pattern that it is, fits this market action. Everything has been 3 waves since 2003. 

Tsharp, porkloin, et al. your comments are always welcome.

cheers,

john

<{POST_SNAPBACK}>


thanks for the post...

Mr. Neeley's stuph is very interesting, and perhaps a bit too deep for my puny little ole brain.

by my current tentative count, and seemingly as per the daily, we have a bit lower to go on the spx to finish out a possible wave-d in an EDT (3-3-3-3-3), then one more move upward in wave-e of the same.

i'm also mindful of an alt count, which i'll not go into here, but is in a recent post below.... if we drop strongly into year's end, that count would be my next favored scenario.


best regards,
tsharp

Posted Image

#4 SilentOne

SilentOne

    Member

  • Traders-Talk User
  • 3,452 posts

Posted 12 November 2005 - 06:33 AM

tsharp, I am looking at the recent move up as now a 1.62 fib of the first leg up from late Oct (1169 to 1204 ~ 35 pts). So many of the abc moves (yes all 3 wave moves agreed) in the last 2 years have been working off this fib extension. I see the $SPX ran to 1235 Friday up from 1179, yielding a 56 pt rise. Again this is 1.62 (35) ~ 56 pts. I would expect an $SPX top right here then unless something is different this time. At the very least there should be a pause. I also think the NDX topped (ST) Friday as well. Any thoughts?? cheers, john
"By the Law of Periodical Repetition, everything which has happened once must happen again and again and again-and not capriciously, but at regular periods, and each thing in its own period, not another's, and each obeying its own law ..." - Mark Twain