

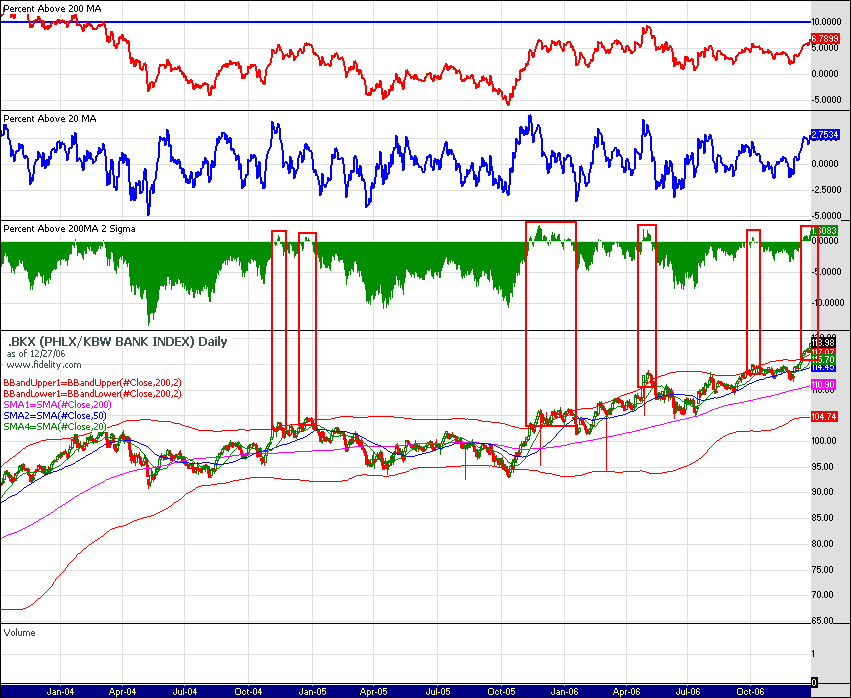
I still think it will be a $BKX exhaustion gap
Started by
spielchekr
, Dec 27 2006 09:56 PM
5 replies to this topic
#1

spielchekr
-
- Traders-Talk User
- 3,104 posts
Member
Posted 27 December 2006 - 09:56 PM
Some coincidental fib here. Using as fib points the 1995 low (60.36, 0%), the 90's bull market high (97.73, 78.6% to today's gap), the subsequent bear market low (60.36, retrace to 38.2%), and today's gap/ yesterday's high (100%). Today busted that layout, along with a diagonal resistance line. Next up is the 1.618% retrace (120.82) from the bear market low. After that, the only two long-term diagonal resistance lines I could find. After that, $200 mil bonuses for everyone.
#2
dcengr
-

- Traders-Talk User
- 13,391 posts
Member
Posted 27 December 2006 - 10:08 PM
Soon my friend... soon 
Qui custodiet ipsos custodes?
#3
eminimee
-

- TT Member
- 14,307 posts
I don't care who's fur is flying...
Posted 28 December 2006 - 07:13 AM
INDU 60 minute:
If we are going to B wave down...a good target is either the 34ema on the hourly at 12432 or the 8ema on the daily which is presently at 12426. That could conceivably set up a right shoulder that has a target of 12705 if the neckline is taken out near the 12530 area. That is well above the top target of the ED but with throwover maybe it could hit it?...Regardless..it's another target to be aware of and if the pattern did fail once above the neckline before reaching it's target.....it's very bearish as a bull trap would have been sprung. If an ED..the target would be the point from which she started..just south of 12000. I'd watch this one...and keep 670 OEX in the back of your collective minds. It's the .618 back to all time highs and the TL connecting the two highs in 2000. A weekly close above 670 and we are going much higher.
http://stockcharts.com/c-sc/sc?s=$IND...00313&r=417
Da Bull:
http://stockcharts.com/c-sc/sc?s=$OEX...8925&r=2344
Da Bear:
http://stockcharts.com/c-sc/sc?s=$OEX...7608&r=7015
http://stockcharts.com/c-sc/sc?s=$OEX&p=M&yr=10&mn=6&dy=0&i=p07517931850&a=71542656&r=6695.png
#4
spielchekr
-
- Traders-Talk User
- 3,104 posts
Member
Posted 28 December 2006 - 01:11 PM
Exhaustion gap now "valid" (that is, relevant). So now, a move below today's intraday low would be looked upon as "confirmation". By definition... http://stockcharts.c.../GlossaryG.html
http://stockcharts.com/c-sc/sc?s=$BKX&p=D&b=5&g=0&i=t04906627019&r=1398.png
http://stockcharts.com/c-sc/sc?s=$BKX&p=D&b=5&g=0&i=t04906627019&r=1398.png
#5
spielchekr
-
- Traders-Talk User
- 3,104 posts
Member
Posted 29 December 2006 - 03:30 PM
Go ahead and say it..."Even a blind pig blah blah oink oink". But don't forget, I learned alot of this stuff right here from you folks. Have a Happy New Year!
#6
spielchekr
-
- Traders-Talk User
- 3,104 posts
Member
Posted 29 December 2006 - 05:07 PM
This 60m island reversal could be additional confirmation of the exhaustion gap.


