
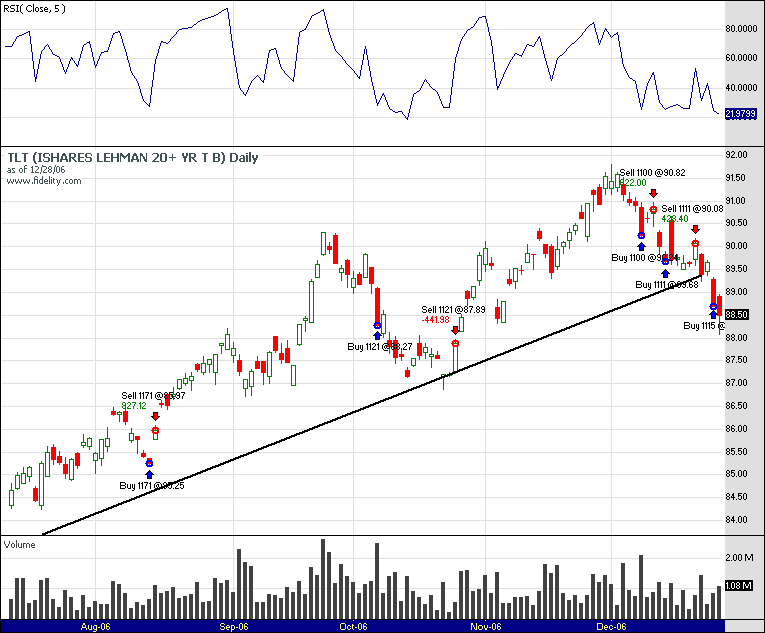
I was following a recurrance of this phenomenon, and I think the turn around for bonds is about here... for one, TLT gave an RSI5 buy signal yesterday. I think it will soon rise up.
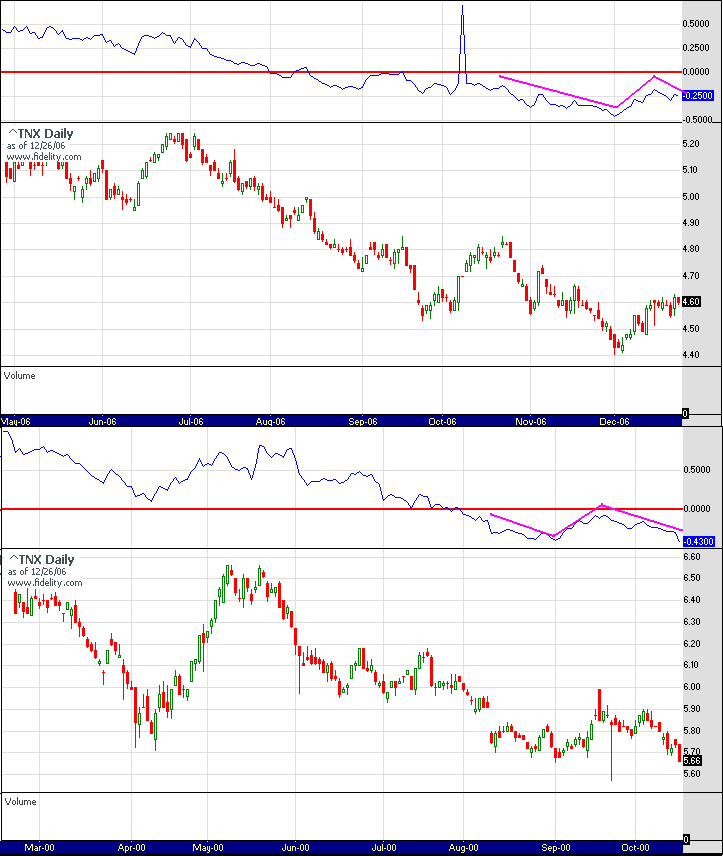
Oh yes, the 2nd chart.. the top graph is 3mo - 10 year yield.. or curve inversion.
Edited by dcengr, 28 December 2006 - 06:08 PM.


