Jump to content


Photo

Interesting discovery of RSI5 relationship to MCO


  • Please log in to reply
8 replies to this topic

#1 dcengr

dcengr

    Member

  • Traders-Talk User
  • 13,391 posts

Posted 05 January 2007 - 11:07 PM

Well one is a chart of RSI5 on SPX, the other is MCO on SPX made of components.. looks darn similar to me if you ask me.

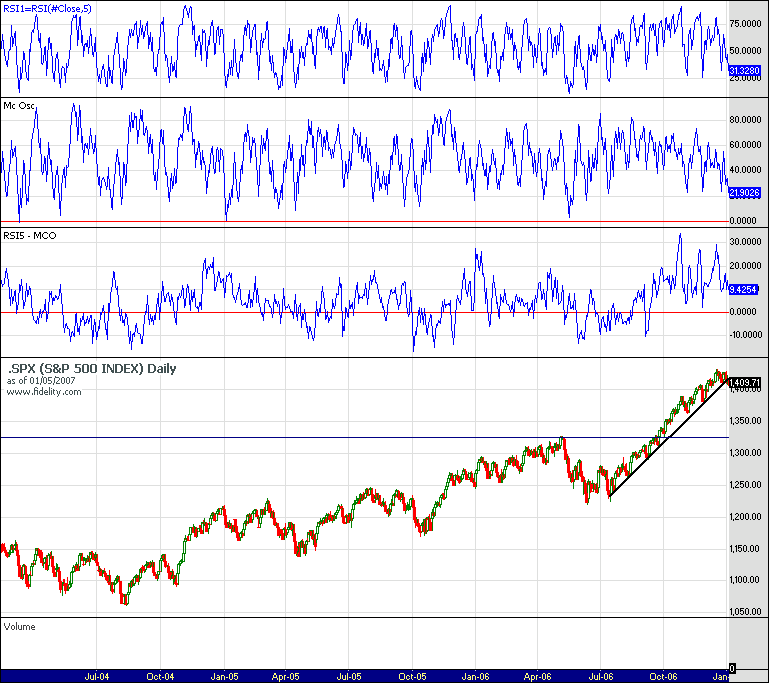
Realize one is constructed simply from the RSI formula off the index price only, while the other is constructed from the A-D line of the SPX 500 components using the MCO formula..

Posted Image

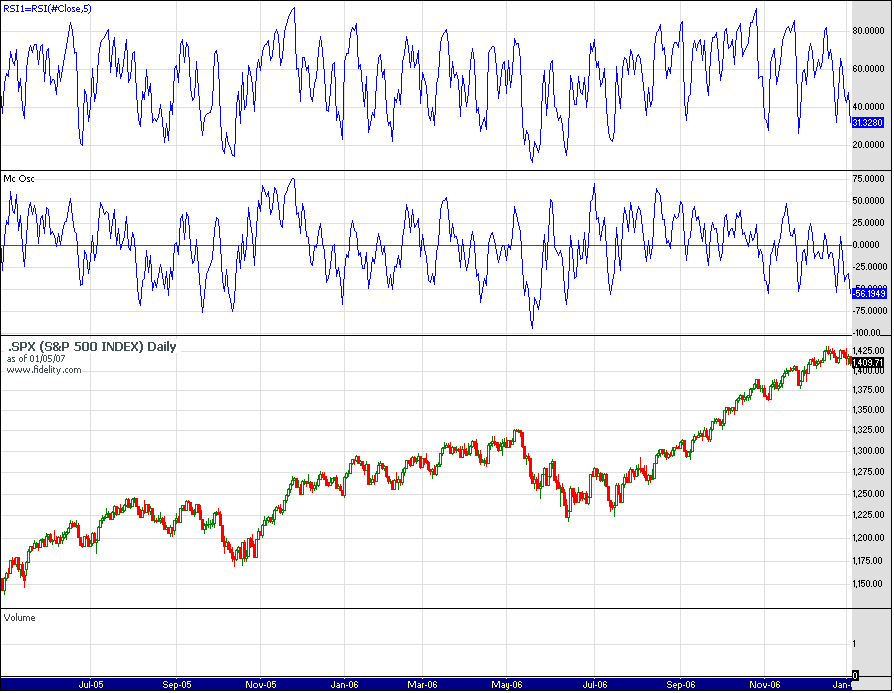
Whats just as interesting is if I take RSI20 of the price, I get a shape thats similar to the McSum... though its not as tight fitting.

Look here, seems to work for everything...

I must investigate the reason for this relationship... will report on it later.

http://stockcharts.com/c-sc/sc?s=$NAAD&p=D&yr=3&mn=0&dy=0&i=p32054617033&a=94068090&r=7983.png

http://stockcharts.com/c-sc/sc?s=$NYAD&p=D&yr=3&mn=0&dy=0&i=p29635362203&a=91163974&r=3237.png

Edited by dcengr, 05 January 2007 - 11:08 PM.

Qui custodiet ipsos custodes?

#2 dcengr

dcengr

    Member

  • Traders-Talk User
  • 13,391 posts

Posted 05 January 2007 - 11:26 PM

Just a FYI for those wanting to help me investigate... this is boggling to me. MCO is generated by the advance decline line.. which is based on # of stocks that go up minus # of stocks that go down.. while RSI is based on pure price..

What is the relationship such that both look the same?

RSI Calculation

RSI = 100 - ( 100 / ( 1 + RS ) )

where,

RSI relative strength index
RS = (average of n bars' up closes) / (average of n bars' down closes)
n = number of bars or period, typically 14


McClellan Oscillator

Developed by Sherman and Marian McClellan, the McClellan Oscillator is a breadth indicator derived from each day's net advances, the number of advancing issues less the number of declining issues. Subtracting the 39-day exponential moving average from the 19-day exponential moving average of net advances forms the oscillator.

Similar to MACD, the McClellan Oscillator is a momentum indicator that is applied to the advance/decline statistics. When the 19-day EMA (shorter moving average) moves above the 39-day (longer moving average) EMA, it signals that advances are gaining the upper hand. Conversely, when the 19-day EMA declines below the 39-day EMA, it signals that declining issues are dominant. As a momentum indicator, the McClellan Oscillator attempts to anticipate positive and negative changes in the AD statistics for market timing.

Buy and sell signals are generated as well as overbought and oversold readings. Usually, readings above +100 are considered overbought and below -100 oversold. Overbought and oversold readings may vary among indices and historical precedent. Buy signals are generated when the oscillator advances from oversold levels to positive territory. Sell signals are generated on declines from overbought to negative territory. Traders may also look for positive or negative divergences to time their trades. A series of rising troughs would denote strength, while a series of declining peaks weakness.
Calculation

When calculating the McClellan Oscillator, the ratio adjusted index is often used for easier comparisons over long periods of time. The basic input for the ratio-adjusted version is no longer the daily advances minus declines. Rather you:

1. Subtract declines from advances
2. Divide the result by the total of advances plus declines, and
3. Multiply that result by 1000. (Multiplying by 1000 is simply cosmetic and lets us work with whole numbers instead of decimals.)

The rest of the calculations for the Oscillator are the same.


Qui custodiet ipsos custodes?

#3 dcengr

dcengr

    Member

  • Traders-Talk User
  • 13,391 posts

Posted 06 January 2007 - 12:05 AM

Just thinking about this a bit... What I think this implies is that the A-D line, which I think many would agree represents money flow.. is somehow related to the 5 day price range (ie high and low).. Furthermore, the MCO is really a MACD of the A-D line, which means its a measure of difference of the fast money flow from the slow money flow. This implies that the 5 day price range (again high and low) is related somehow to a base money amount affected by a change in the base money amount.. I'm not sure if I'm being clear, but its hurting my head thinking about it :lol: This is a wild concept.. it says if prices change by x amount, then y # of issues must go up or down, and vice versa over a period of time.
Qui custodiet ipsos custodes?

#4 mss

mss

    I'M WATCHING

  • TT Sponsor
  • 6,182 posts

Posted 06 January 2007 - 12:26 PM

:)
VERY nice work.
I offer the following chart for your thought process as you "tweak" your study. Consider RSI-7, timing difference, and compare with other indicators you may like. Some of mine are on this chart. All GREEN (bottom) & RED (top) lines are placed on selected points of the $NYMO to see how they might line up with other indicators. Notice the last dashed red line and current market action. Everything is based off the $NYA price (red ohlc) in first chart below $NYMO.
Looking forward to your finished analysis and chart.

Thanks for all your work you share here.

Posted Image
WOMEN & CATS WILL DO AS THEY PLEASE, AND MEN & DOGS SHOULD GET USED TO THE IDEA.
A DOG ALWAYS OFFERS UNCONDITIONAL LOVE. CATS HAVE TO THINK ABOUT IT!!

#5 dcengr

dcengr

    Member

  • Traders-Talk User
  • 13,391 posts

Posted 06 January 2007 - 11:52 PM

:)
VERY nice work.
I offer the following chart for your thought process as you "tweak" your study. Consider RSI-7, timing difference, and compare with other indicators you may like. Some of mine are on this chart. All GREEN (bottom) & RED (top) lines are placed on selected points of the $NYMO to see how they might line up with other indicators. Notice the last dashed red line and current market action. Everything is based off the $NYA price (red ohlc) in first chart below $NYMO.
Looking forward to your finished analysis and chart.

Thanks for all your work you share here.


Thanks in return to everyone who shares their work here. I've learned so much from all the people who share their work.

RSI-7 seems similar enough to RSI-5, and it is 1/2 of RSI-14 which is based on the 28 day moon phase cycle. So maybe there's some sort of relationship there.

I've looked at RSI-28 and that seems to somewhat follow the MCSUM shape. A break of RSI-28 on the 50 line would be equivalent to a MCSUM break of the zero line.

A lot of IT tops are formed when a divergence in MCSUM and price occurs. Same with RSI-28. A loss of price momentum is in essence a loss of momentum in moneyflow, at least evidenced by this relationship. But thats obvious but we now have some visual proof that it is because of the close relationship we can see between RSI and MCSUM.
Qui custodiet ipsos custodes?

#6 kaiser soze

kaiser soze

    Member

  • Traders-Talk User
  • 884 posts

Posted 07 January 2007 - 01:58 AM

I think the strong correlation between RSIs on the NAAD and NYAD charts with the respective values of the NAMO and NYMO themselves is tautological. I remember that the RSI implementation in software involves a ratio adjusted derivative of the exponential moving average of the respective number of periods. I am sorry I cant find a reference to that exact effect but I am nearly 100% sure I read about it someplace. Now the Mclellan oscillator is by definition a ratio adjusted difference of two exponential moving averages. Of course, they would be very highly correlated. However the correlation between the RSI of price on the SPX chart and the MCO/MCSUM is definitely intriguing, especially if found to be true more generally. I find it difficult to believe that it "arises naturally " from the price action. That a loss of price momentum is a natural consequence of loss of momentum of moneyflow. I highly doubt that for an individual stock, the correlation between price and moneyflow would be that straightforward. My conspiracy theory guess is that quantitative trading programs engineer it i.e. they watch the momentum of moneyflow and engineer the resulting price momentum on indices and ETFs by executing high probability arbitrage trades. A great observation though. Kudos to you.

Edited by kaiser soze, 07 January 2007 - 02:02 AM.


#7 jjc

jjc

    Member

  • Traders-Talk User
  • 2,886 posts

Posted 07 January 2007 - 12:51 PM

!Kudos DC. To exploit it you might look at what happens when they diverge. jjc

#8 arbman

arbman

    Quant

  • Traders-Talk User
  • 19,504 posts

Posted 07 January 2007 - 10:04 PM

Dcengr, I think NAMO rolls before RSI, the extremes require steady directional move and this is usually achieved with the breath thrusts, so you see the correlation. Otherwise, these usually turn out to be serious divergences anyway... If you pay attention you can see that the tops and the shapes of the breath (NAMO) momentum are usually much more bearish left translated than the RSI which usually peaks with the price momentum, rather than the breath momentum. The last one to top is usually the prices. So, you actually get 3 sets of divergences before a major or IT top... - kisa

Edited by kisacik, 07 January 2007 - 10:05 PM.


#9 dcengr

dcengr

    Member

  • Traders-Talk User
  • 13,391 posts

Posted 08 January 2007 - 12:33 AM

Dcengr, I think NAMO rolls before RSI, the extremes require steady directional move and this is usually achieved with the breath thrusts, so you see the correlation. Otherwise, these usually turn out to be serious divergences anyway...

If you pay attention you can see that the tops and the shapes of the breath (NAMO) momentum are usually much more bearish left translated than the RSI which usually peaks with the price momentum, rather than the breath momentum. The last one to top is usually the prices. So, you actually get 3 sets of divergences before a major or IT top...

- kisa


I'm not sure Kisa.. I took the difference between RSI5 and NAMO (I shifted NAMO to be between 0 to 100), and I was looking for such a shift.

There were some instances where a large difference did seem to indicate a sort of top, but not all instances..

Posted Image
Qui custodiet ipsos custodes?