
Interesting FF Sentiment Chart
Started by
OEXCHAOS
, Jan 12 2007 10:25 AM
14 replies to this topic
#1

OEXCHAOS
-
- Admin
- 22,019 posts
Mark S. Young
Posted 12 January 2007 - 10:25 AM
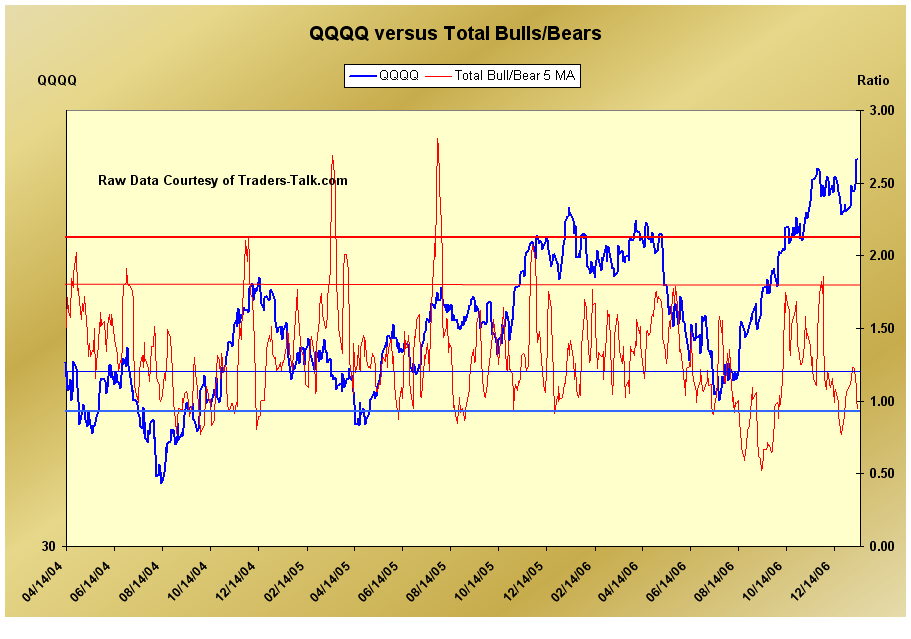
Originally posted by dcengr, but I thought I'd put it up as a clean chart. BTW, I look at the poll data differently, but this is an interesting approach.
Mark S Young
Wall Street Sentiment
Get a free trial here:
http://wallstreetsen...t.com/trial.htm
You can now follow me on twitter
#2
dcengr
-

- Traders-Talk User
- 13,391 posts
Member
Posted 12 January 2007 - 10:28 AM
You know how I construct that?
I basically add the bull% from opinion polls and position polls. Then divide that with similar from bears. Then I take the 5MA of it.
Therefore, the ratio takes into account both opinion and position polls.
Qui custodiet ipsos custodes?
#3
mdwllc
-

- Traders-Talk User
- 574 posts
Member
Posted 12 January 2007 - 10:58 AM
OEXChaos: So how do you look at the data? Mike 
Lead, Follow or Get Out of the Way...
Be Sure to Perform Your Own Due Diligence
Be Sure to Perform Your Own Due Diligence
#4
OEXCHAOS
-
- Admin
- 22,019 posts
Mark S. Young
Posted 12 January 2007 - 01:07 PM
I look at the actual position poll separately from the opinion poll. The FF tend to get the direction right when they guess--at least more often than not.
The actual position poll tells us a lot about the conviction levels of traders.
I don't combine the two measures.
Mark
Mark S Young
Wall Street Sentiment
Get a free trial here:
http://wallstreetsen...t.com/trial.htm
You can now follow me on twitter
#5
fib_1618
-

- Traders-Talk User
- 10,145 posts
Member
Posted 12 January 2007 - 04:56 PM
Are you sure it was "originally" posted by dcengr?Originally posted by dcengr
Are you sure that you constructed the data in its current form? Seems to me that the only difference is that you decided to use the QQQQ as a proxy instead of the originators used comparison of the SPX?You know how I construct that? I basically add the bull% from opinion polls and position polls. Then divide that with similar from bears. Then I take the 5MA of it.
Maybe a clarification is warranted on the difference?
Fib
Better to ignore me than abhor me.
“Wise men don't need advice. Fools won't take it” - Benjamin Franklin
"Beware of false knowledge; it is more dangerous than ignorance" - George Bernard Shaw
Demagogue: A leader who makes use of popular prejudices, false claims and promises in order to gain power.
Technical Watch Subscriptions
#6
dcengr
-
- Traders-Talk User
- 13,391 posts
Member
Posted 12 January 2007 - 05:01 PM
Are you sure it was "originally" posted by dcengr?Originally posted by dcengr
Are you sure that you constructed the data in its current form? Seems to me that the only difference is that you decided to use the QQQQ as a proxy instead of the originators used comparison of the SPX?You know how I construct that? I basically add the bull% from opinion polls and position polls. Then divide that with similar from bears. Then I take the 5MA of it.
Maybe a clarification is warranted on the difference?
Fib
I believe that's my original construct. The chart looks familiar because the original data was provided by Mortiz. But he did not construct the data the way I did (since I have his original excel file, I should know!).
So yes, thanks to Randy for providing me the data
 . But what I'm doing was not part of his spreadsheet.
To further clarify, if you will read how I constructed the data, it should be clear. As far as I know, Randy's work was separated into opinion and position polls (thats what I saw anyways).
I also noticed that sentiment is much more geared towards Qs than SPX.
Edited by dcengr, 12 January 2007 - 05:07 PM.
Qui custodiet ipsos custodes?
#7
Rich
-

- Traders-Talk User
- 761 posts
Member
Posted 13 January 2007 - 11:02 AM
Mark,
It's a little hard to see the correlation between the price and ratio.
Can you plot the 5-day forward slope of the qqqq price vs the bull/bear ratio? This would be just points corresponding to the day values. If you can't do the slope, the difference between two EMAs of the price might work. I would try 5- and 10-day EMAs.
Thanks,
Rich
Edited by Rich, 13 January 2007 - 11:07 AM.
#8
dcengr
-
- Traders-Talk User
- 13,391 posts
Member
Posted 13 January 2007 - 11:54 AM
Mark,
It's a little hard to see the correlation between the price and ratio.
Can you plot the 5-day forward slope of the qqqq price vs the bull/bear ratio? This would be just points corresponding to the day values. If you can't do the slope, the difference between two EMAs of the price might work. I would try 5- and 10-day EMAs.
Thanks,
Rich
I've been meaning to look at the polls like MCO/MSUM... What would be nice is if in that file library that Mark may make, we can contribute excel files of data such as this.
Qui custodiet ipsos custodes?
#9
OEXCHAOS
-
- Admin
- 22,019 posts
Mark S. Young
Posted 13 January 2007 - 06:16 PM
Heck yeah. Send me what you have and I or GD will create an upload area for them. I think that patrons can upload excel files now, but I'm not entirely sure. If anyone has any security suggestions, let me know.
Send to admin here at traders-talk.com
Mark S Young
Wall Street Sentiment
Get a free trial here:
http://wallstreetsen...t.com/trial.htm
You can now follow me on twitter
#10
U.F.O.
-

- TT Patron+
- 5,605 posts
U.F.O.
Posted 15 January 2007 - 10:03 PM
I like it. It seems pretty obvious we're in "buy" territory right now. One would sell the bullish spikes. Mark, is there a possibility you could keep posting this on a daily basis. Maybe make it a "sticky" thread in it's current position at the top of the FF board?
U.F.O.
"Democracy is two wolves and a lamb voting on what to have for lunch. Liberty is a well-armed lamb contesting the vote!"
~Benjamin Franklin~
~Benjamin Franklin~


