Jump to content


Photo

MA, RSI, Stoch


  • Please log in to reply
1 reply to this topic

#1 dcengr

dcengr

    Member

  • Traders-Talk User
  • 13,391 posts

Posted 18 January 2007 - 10:50 PM

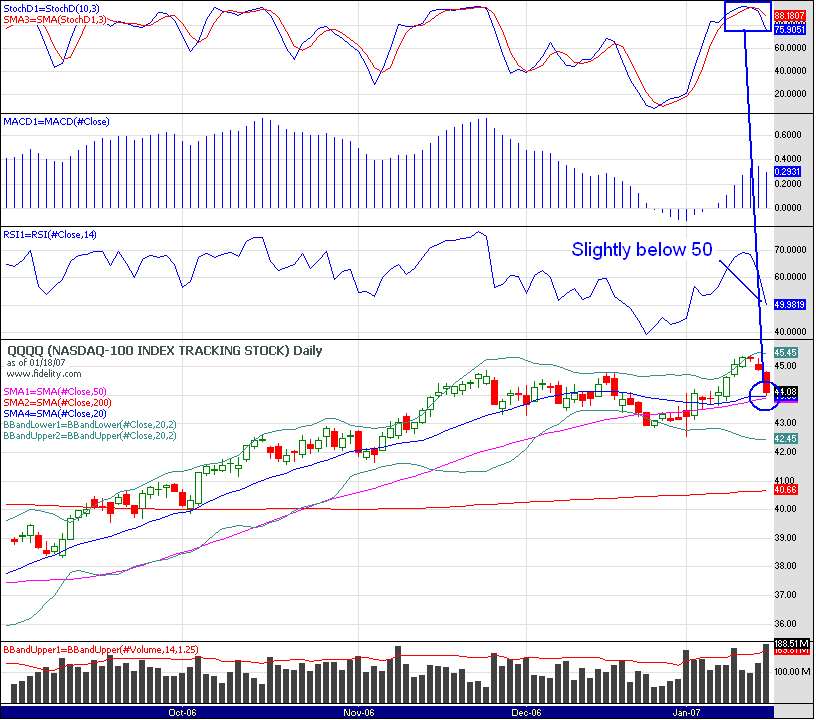
This chart shows the RSI14 dipping below 50, Stoch cross over, and price finding support at 20MA and 50MA area. Real decision point here. The RSI and Stoch are bearish, and a dip tomorrow would break the 20MA and the 50MA... if it doesn't bounce that is.

Posted Image

Meanwhile, SOXX busts 20, 50 and 200MA..

Posted Image

Edited by dcengr, 18 January 2007 - 10:57 PM.

Qui custodiet ipsos custodes?

#2 Iblayz

Iblayz

    Member

  • TT Patron+
  • 1,033 posts

Posted 18 January 2007 - 11:14 PM

http://stockcharts.com/h-sc/ui?s=$SOX&p=D&st=2006-01-12&id=p95596003501&a=95365607