

TOL
Started by
CLK
, Jan 19 2007 05:50 PM
28 replies to this topic
#2

dcengr
-

- Traders-Talk User
- 13,391 posts
Member
Posted 19 January 2007 - 05:54 PM
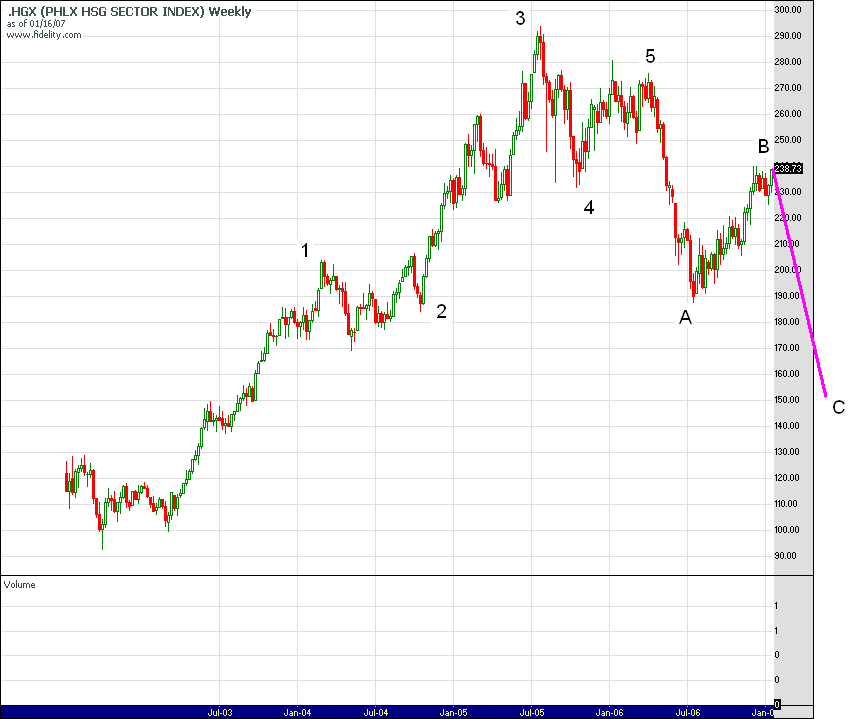
The breadth data for HGX components may suggest we're in wave B of the entire move.. since breadth is pretty nasty while price is going up.
Qui custodiet ipsos custodes?
#3
eminimee
-

- TT Member
- 14,307 posts
I don't care who's fur is flying...
Posted 19 January 2007 - 06:30 PM
I'm just going out the door for dinner....I don't profess to be an expert by any means but you guys need to brush up a bit on ewave...both those counts make me cringe.
I'll expand it bit tomorrow....(unless Nav or Fib get to you first) LOL
#4
dcengr
-
- Traders-Talk User
- 13,391 posts
Member
Posted 19 January 2007 - 06:49 PM
I'm just going out the door for dinner....I don't profess to be an expert by any means but you guys need to brush up a bit on ewave...both those counts make me cringe.
I'll expand it bit tomorrow....(unless Nav or Fib get to you first) LOL
Ha ha. If you don't come up with at least 3 different counts by the time you post, I'll be disappointed
 .
.In fact, I'll wager that if you, nav, and Fib were to independently do a count, they would ALL look different

Qui custodiet ipsos custodes?
#5
fib_1618
-

- Traders-Talk User
- 10,145 posts
Member
Posted 19 January 2007 - 07:20 PM
ROFL...Nope, be my guest E/T...they're all yours!I'll expand it bit tomorrow....(unless Nav or Fib get to you first)
What I would suggest to everyone when trying to apply Elliott counts is that you keep it really simple, and by all means, please follow the strict rules of the methodology (this would include reading every page of the book and not scanning it to find something that would suit a particular purpose).
Simple means taking the chart pattern and looking at it in line form, close only, to see if it has the "right look". This will also clean up the garbage of the intraday action which suits no real purpose to begin with.
Following the strict rules of Elliott are paramount from keeping you from going completely insane (and I have seen many who have over the last 30 years). And above all else, the degree of labeling is the single most important thing in Elliott's application. If there's any one area in which 90% of analysts fail when using Elliott it is in their knowing exactly the degree of the price pattern structure. Without this specific knowledge, it would be like acknowledging a head and shoulders pattern formation and not including the volume characteristics that make such a pattern viable.
That might be, but I would bet you a large lunch at a drive through of your choice that all three of us would be following the rules laid out in the blue book and not seemingly guessing as you've done with your attempt in this thread. Furthermore, we would all be able to back up the count consideration with various technical tools that key in on the character of the price action, and the momentum behind it, that would allow the count idea to have the merit of even being considered in the first place.In fact, I'll wager that if you, nav, and Fib were to independently do a count, they would ALL look different
Hint: You can not in any way have a personal emotional bias in using Elliott. Until you rid yourself of this albatross, you're just going to be spinning your wheels in your effort to utilize such a tool in your trading strategy.
Fib
Better to ignore me than abhor me.
“Wise men don't need advice. Fools won't take it” - Benjamin Franklin
"Beware of false knowledge; it is more dangerous than ignorance" - George Bernard Shaw
Demagogue: A leader who makes use of popular prejudices, false claims and promises in order to gain power.
Technical Watch Subscriptions
#6
dcengr
-
- Traders-Talk User
- 13,391 posts
Member
Posted 19 January 2007 - 07:39 PM
That might be, but I would bet you a large lunch at a drive through of your choice that all three of us would be following the rules laid out in the blue book and not seemingly guessing as you've done with your attempt in this thread. Furthermore, we would all be able to back up the count consideration with various technical tools that key in on the character of the price action, and the momentum behind it, that would allow the count idea to have the merit of even being considered in the first place.
Hint: You can not in any way have a personal emotional bias in using Elliott. Until you rid yourself of this albatross, you're just going to be spinning your wheels in your effort to utilize such a tool in your trading strategy.
Fib
Hmm lets see, guessing vs having 3 different answers
 Whats the difference? Oh yes, with one, you have the chance of it being wrong. With the other, you have the pretense of being right on the belief that you have a unique understanding of something that can derive multiple answers from 3 different people who claim to be an "expert" in the field . And yet, the right to change the count will be reserved, ofcourse, because even the counts that are presented.. may not unfold the way it is
  .
.Hint: The best way for you to demonstrate your ability and expertise in such manner, is for you to present your count, here, on this board, for everyone to see. Then, as the price data unfolds, lets see if you are correct, or if you will revise your count
. Or.. the fear of being wrong when one claims to be an expert might be a bit overwelming I think EW is fascinating, but there are many rules and exceptions to the rules that allow for almost limitless possibilities. But definately, there are observations of the market in Elliott's work that do open one's eyes on how to view the market.
Qui custodiet ipsos custodes?
#7
CLK
-
- Traders-Talk User
- 10,787 posts
Member
Posted 19 January 2007 - 07:57 PM
I think 5 wave structures are easier for me to recognize near their completion,
at least I've had success with them on the NDX before.
Fractals work well in finding turns, although the aftermath of the turn
does not always unfold exactly the same, but usually close.
What is more difficult , is recognizing early on, if a correction is an
ABC or the start of a more complex wave structure.
I think TOL may go up another 1/4 but should then fill the gap at 31.25.
Edited by CLK, 19 January 2007 - 08:02 PM.
#8
dcengr
-
- Traders-Talk User
- 13,391 posts
Member
Posted 19 January 2007 - 08:09 PM
Btw, I don't mean to make it sound like EW is bunk, for those who do successfully use it in trading.
I do understand there IS a difference between proper EW counting and direction of the market. However, I do understand that the purpose of EW is to predict the market direction, and if a tool can derive too many possibilities to an outcome because even the experts disagree on its application, then that implies the tool still has room for improvements.
Precher comes to mind in his expertise of EW. If he doesn't understand the rules, no one does. But understanding the rules and predicting the proper market outcome are different, ofcourse. Its likely the proper application of risk control that separates Precher from someone like PTJs who uses it successfully. When no matter how well the rules are applied and a count comes forth, if price doesn't cooperate, you are wrong.
So, since us EW noobs wouldn't mind an education from the more experienced EWtists of the board, I would encourage you to post your own versions of the chart, explain why the counts are labeled as such (with whatever supporting technical evidence you want to present), and give us an entry/exit with stops.
It would be an interesting experiment in any event. So.. Fib, Nav, EM, are you up for it? I know EM posts his charts all the time, and quite a number of various counts. And I appreciate him sharing his work (having learned what I can from it).
According to Elliott Wave Principles, the two most recognizable wave structures are wave 3, and wave B. Wave 3 being a powerful thrust where all stocks participate, wave B being phonies, where odd-lot mentality and weak technicals are the norm.
Coming from a technical (ie scientific) background, my take on EW isn't as "hard" as some of the purist. Even Precher allows for many exceptions. The important thing is that patterns often repeat, and odds are with you by following the rules because the rules were created from many repeated observations of the same recurrance. But the fact is, it may give one 60% edge, much like card counting in black jack, following the rules, but its not 100% or anything close to it. Hence, one can always "guess" using the rules or something close to the rules, but its proper risk management which always makes one most successful using EW than EW alone.
I do understand there IS a difference between proper EW counting and direction of the market. However, I do understand that the purpose of EW is to predict the market direction, and if a tool can derive too many possibilities to an outcome because even the experts disagree on its application, then that implies the tool still has room for improvements.
Precher comes to mind in his expertise of EW. If he doesn't understand the rules, no one does. But understanding the rules and predicting the proper market outcome are different, ofcourse. Its likely the proper application of risk control that separates Precher from someone like PTJs who uses it successfully. When no matter how well the rules are applied and a count comes forth, if price doesn't cooperate, you are wrong.
So, since us EW noobs wouldn't mind an education from the more experienced EWtists of the board, I would encourage you to post your own versions of the chart, explain why the counts are labeled as such (with whatever supporting technical evidence you want to present), and give us an entry/exit with stops.
It would be an interesting experiment in any event. So.. Fib, Nav, EM, are you up for it? I know EM posts his charts all the time, and quite a number of various counts. And I appreciate him sharing his work (having learned what I can from it).
I think 5 wave structures are easier for me to recognize near their completion,
at least I've had success with them on the NDX before.
Fractals work well in finding turns, although the aftermath of the turn
does not always unfold exactly the same, but usually close.
What is more difficult , is recognizing early on, if a correction is an
ABC or the start of a more complex wave structure.
I think TOL may go up another 1/4 but should then fill the gap at 31.25.
According to Elliott Wave Principles, the two most recognizable wave structures are wave 3, and wave B. Wave 3 being a powerful thrust where all stocks participate, wave B being phonies, where odd-lot mentality and weak technicals are the norm.
Coming from a technical (ie scientific) background, my take on EW isn't as "hard" as some of the purist. Even Precher allows for many exceptions. The important thing is that patterns often repeat, and odds are with you by following the rules because the rules were created from many repeated observations of the same recurrance. But the fact is, it may give one 60% edge, much like card counting in black jack, following the rules, but its not 100% or anything close to it. Hence, one can always "guess" using the rules or something close to the rules, but its proper risk management which always makes one most successful using EW than EW alone.
Qui custodiet ipsos custodes?
#9
fib_1618
-
- Traders-Talk User
- 10,145 posts
Member
Posted 19 January 2007 - 08:13 PM
Sigh...we've been down this road before and it served no real purpose (right Norton?).The best way for you to demonstrate your ability and expertise in such manner, is for you to present your count, here, on this board, for everyone to see.
I am, however, currently working with an ongoing Elliott count on the US Dollar, and have done so for nearly a year now. If you wish to review that exercise, you can find it over at Technical Watch.
As far as my so called "expertise", and my "guru" status, I have never claimed to be either. I am a student of the market just like everyone else that reviews the comments posted here and elsewhere. As far as my "ability" is concerned when it comes to technical analysis, I, unlike others, work directly with many people on a one to one basis in sharing my knowledge when it comes to various types of price pattern analysis, and evidently, do a fairly good job at it going by the information shared and the eventual outcomes. And so, I will let my track record speak for itself.
Unfortunately though, it would seem that once again I have over stayed my welcome here at Traders-Talk in my continuing attempt of nudging people in the right direction while not trying to be seemingly pompous in the process. This has never been my intention, but since it would seem otherwise, another break from posting here at Traders-Talk seems to be necessary.
You all know where I can reached, and thank you Mark (et al) for continuing to provide a nice place for many to call home.
Good Trading
Fib
Better to ignore me than abhor me.
“Wise men don't need advice. Fools won't take it” - Benjamin Franklin
"Beware of false knowledge; it is more dangerous than ignorance" - George Bernard Shaw
Demagogue: A leader who makes use of popular prejudices, false claims and promises in order to gain power.
Technical Watch Subscriptions
#10
PorkLoin
-

- TT Member*
-

- 2,194 posts
Member
Posted 19 January 2007 - 08:23 PM
This goes along with Fib's point about labeling and keeping an eye on what degree of trend we think is the deal. TOL started on the NYSE and made a low in 1994, then up to a high in 1998. That could be wave 1, and down to 1999 for 2, but I'm not worried about it right now.

This "big picture" view shows a whopper of an uptrend from the 1999 low and then a stout decline. Correction ended? Took off again to the upside from the support around 22.50? This weekly MACD might be rolling over here. If nothing else it might need a rest/recharge before going for 35, 40, 45. Who knows?

So, was the move into last July's low a correction, or an impulse? I think it can be counted either way. If it was a completed correction, however, then going up from the July low we should be impulsive again, and it's awful choppy and overlapping for that. Yet the move into the July low was $36+ and even a correction of that should be worth playing.

I wouldn't just buy this and forget about it, figuring we're in another grand rally like into the 2005 high. Very unsure about the nature of the decline from that high, but going up from last July this thing looks corrective to me.
Weekly momentum may be flagging, but it's not tanking yet, and if anything I'd count TOL as ABC from the July low to the mid-October high. Then X down to the November low. Might well be making a double zig-zag, and that would have another ABC from the Nov. low.
Looks okay for the 2nd A up to the December high, and B down to the Jan. low. So, we'd be going up in C now. Daily momentum (the MACD) looks bullish right here, so that's the way I'd play it -- long for the move up from the December low, but not counting on anything more than a still-ongoing correction from the July low. 5 waves up from the low on Jan. 8 and we could be done here. I'd follow this bad boy up with sell stops.
Best,
Doug
This "big picture" view shows a whopper of an uptrend from the 1999 low and then a stout decline. Correction ended? Took off again to the upside from the support around 22.50? This weekly MACD might be rolling over here. If nothing else it might need a rest/recharge before going for 35, 40, 45. Who knows?
So, was the move into last July's low a correction, or an impulse? I think it can be counted either way. If it was a completed correction, however, then going up from the July low we should be impulsive again, and it's awful choppy and overlapping for that. Yet the move into the July low was $36+ and even a correction of that should be worth playing.
I wouldn't just buy this and forget about it, figuring we're in another grand rally like into the 2005 high. Very unsure about the nature of the decline from that high, but going up from last July this thing looks corrective to me.
Weekly momentum may be flagging, but it's not tanking yet, and if anything I'd count TOL as ABC from the July low to the mid-October high. Then X down to the November low. Might well be making a double zig-zag, and that would have another ABC from the Nov. low.
Looks okay for the 2nd A up to the December high, and B down to the Jan. low. So, we'd be going up in C now. Daily momentum (the MACD) looks bullish right here, so that's the way I'd play it -- long for the move up from the December low, but not counting on anything more than a still-ongoing correction from the July low. 5 waves up from the low on Jan. 8 and we could be done here. I'd follow this bad boy up with sell stops.
Best,
Doug


