Edited by selecto, 27 January 2007 - 06:40 PM.

Key reversal code
#11

Posted 27 January 2007 - 06:35 PM
#12

Posted 27 January 2007 - 06:40 PM
Edited by The End, 27 January 2007 - 06:41 PM.
#13

Posted 27 January 2007 - 06:55 PM

Edited by selecto, 27 January 2007 - 07:00 PM.
#14

Posted 27 January 2007 - 07:05 PM

Edited by The End, 27 January 2007 - 07:09 PM.
#15

Posted 27 January 2007 - 07:52 PM
#16

Posted 27 January 2007 - 08:11 PM
I will save you from the further killing of your time and say the candlestick patterns are not high probability trading signals alone. But if you get that big candle at the end of a momentum and breath exhaustion, it is usually a trend change signal with or without a KRD signal. In that sense, the KRD doesn't make the signal any higher or lower probability than it actually was. You don't have to over analyze the candlestick patterns, imho. I would worry about the underlying cyclical pattern and the momentum strength a whole lot more...
- kisa
Agreed 100%.
#17

Posted 27 January 2007 - 08:28 PM
I will save you from the further killing of your time and say the candlestick patterns are not high probability trading signals alone. But if you get that big candle at the end of a momentum and breath exhaustion, it is usually a trend change signal with or without a KRD signal. In that sense, the KRD doesn't make the signal any higher or lower probability than it actually was. You don't have to over analyze the candlestick patterns, imho. I would worry about the underlying cyclical pattern and the momentum strength a whole lot more...
- kisa
One simple pattern usually is not. A sequence of patterns filtered by other parameters, which may include breadth, size of reversal, etc, is likely a higher probability.
But it is important to show that theories should be backtested, despite what's written or believed by many or the few.
No matter how successful one may seem using whatever methods one claims to use, backtesting is an important step into convincing others that the method works or doesn't work.
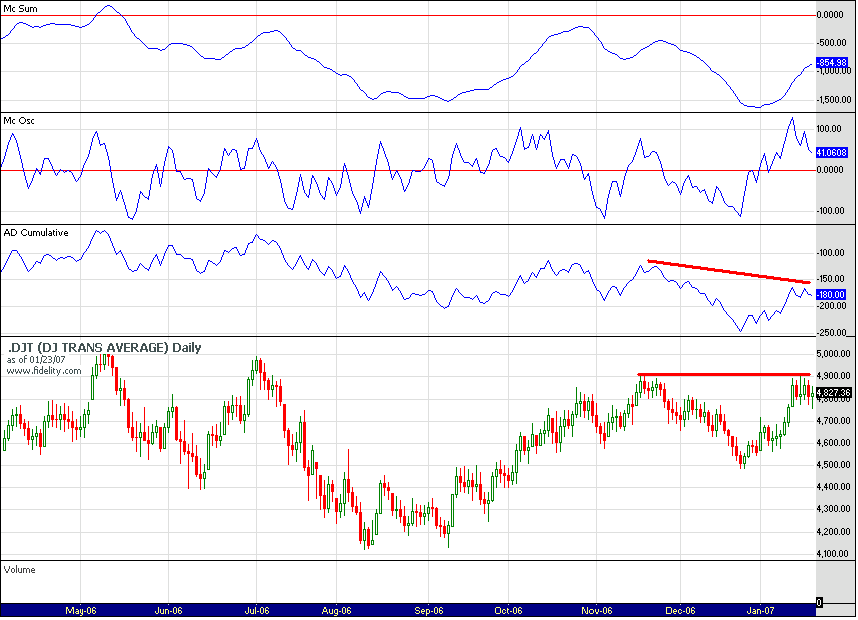
I once asked whether divergence in the cum A-D was a requisite for determining IT tops as was implied by some here. I could never find evidence that even remotely suggested that 50% of IT tops was indicated by a divergence in cum A-D. Hence its always important to backtest, at least if you want to convince this ole engineer who's worked in the aerospace industry where confidence in satellite projects usually must run as high as 5 9s.
Still, I have discovered that though an IT top can be formed with a divergence in cum A-D, if a divergence in A-D was observed, the odds of at least a ST top was greatly increased. This I can show statistically.
#18

Posted 27 January 2007 - 08:48 PM

#19

Posted 27 January 2007 - 09:19 PM
Close < Low of the prior bar
New 52 week (252 daily bars) high
Found that shorting the close and covering 5 bars later had the greatest chance of success (75% winners) though other holding horizons netted greater cumulative gains with lower degree of success.
Not a lot of signals....backtested at least all the way back to Feb99

Average winner netted just under 1%; cumulative net gains for 12 signals was 5.3%....

#20

Posted 27 January 2007 - 09:41 PM

Results of all 7 tests....top row shows how many bars (in this case weeks) held. Maybe more here than originally thought and very supportive of my view that better buying opps lie ahead


