


We now have breakout targets are met and markets are trading at VLT TL resistances as shown on the VLT DOW-SPX charts.
My last comment on the 86yr VLT comments
DOW has broken above 7yr resistance of Jan 2000 intra-high of 11749.49 in Oct 06 37% in 33 mo then rallied 76% in 52 months with intra-high of 12623.45, but now retrieved from the 86yr VLT TL resistance near 12600, as shown on the close-up chart at the bottom-right corner.
During Jun 2006, I commented on the 86yr VLT trend line support as one of factors supporting the bottom call and, in Sept 2006, on VLT DOW chart showing 86yr TL trendline supports with sequences of 1000 point breakouts. Now we have 623 point advance after 12000 breakout however, we already have about 900 point advance from the 11749.49 Jan 2000 and 979.12 points from May 06 high (12621.77-11642.65). Furthermore, since the Jun-Jul06 bottom, the rally point is 100% Fib extension of 1-2 which is equal the points of 2-3 showing normal breakout target from May06 top. Therefore, DOW reached the breakout target and now is trading at a strong resistance.
DOW VLT Trendline Chart

SPX 45yr VLT Trendlines
SPX Commented on the SPX 45yr VLT TL and DOW 86yr VLT TL supports during the Jun-Jul06 bottoming process, quoting, the Price Chanel is evolved from rising wedge formation. As shown on the SPX VLT chart, we now have SPX traded to the upper TL resistance 1440. Also, noted that SPX 1440 +/- is Nov2000 resistance.
SPX VLT Trendlines

Comment on Market Direction
As noted on the DOW LT chart with green buy signals, I have called Aug04 and Jun-Jul06 bottom calls based on the very LT trendline supports as reasoning for the call among other market analyses. Now DOW is at the upper VLT resistance and the question is whether I can call the top of the LT sell signal (LT Top). Given breadth negative divergences which I noted during the last few weeks and given the length of this bull market, debatable secular-cyclical bull market, I believe that a market correction is a healthy course of market action; however, calling a LT top is taken with caution because the current bullish sentiment is strong. This is because the Fed is supporting this market. The main reason is that we are in a war which is making public sentiment is getting worse about decisions made by the current administration; therefore, Pres Bush and the Fed will likely keep the market condition to be perceived as bullish by multi-year high price actions as we are seeing. This is a main underlying market psychology which I am seeing in addition to the Breakout technical psychology which I noted before. Therefore, calling LT market top is risky, thus, I will wait for a confirmation.
We have GOOG and over 500 company earning report. Also we have major economic news such as GDP and ISM and the Fed announcement during the next week, so it will be on interesting week.
Happy Trading and Good luck to ALL

~~~~~~~~~~~~~~~~~~~~~~~~~~~~~~~~~~~~~~~~~~~~~~~~~~~~~~~~~~~~~~~~~~~~
Note on the 1998-1999 "RST" formation and 2006-2007 price actions
As shown below, additional significance of the mid 1998-1999 rally is that
the rally point is exactly the textbook breakout target as shown on the
breakout chart in addition to the "megaphone" formation.
As we can see on the 2006-2007 breakout chart, the megaphone formation is
not as precise as the 1998-1999 megaphone formation, since we don't have the
same precise rhythm of RST. However, we can see that we have perfect
"Breakout Target" has been reached at the 86yr Trendline
Resistance.


Market Breadth - negative divergences
As commented on the breadth negative divergences during the last few weeks, market breadth is continuing to show negative divergences as shown below.


~~~~~~~~~~~~~~~~~~~~~~~~~~~~~~~~~~~~~~~~~~~~~~~~~~~~~~~~~~~~~~~~
I find this website interesting. This is my comment on a board.
http://img256.images...0804ltc1fz2.png
My previous post on the 8yr Global Business Cycle... which is further elaborated as shown on this website:
on Global Economic Cycle
Good luck to ALL
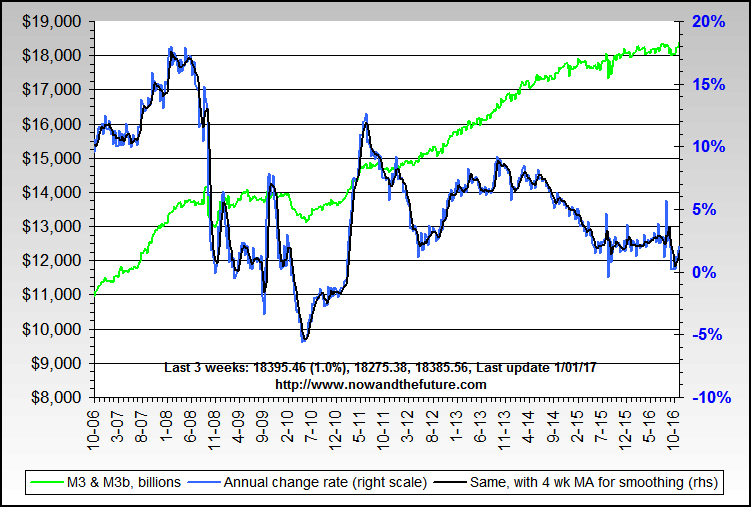
As we can see, the M3 is continuing to rise since the last time when it was published. I am not sure how they (NAF - nowandfutures.com) tracked the information. Since you might have read other comments on NAF, please do comment on those with your own thoughts.
http://www.nowandfut...m/forecast.html
On this, they also sited "Global Business Cycle" which I commented on during 2006 Mid year. Their comments on the GBC is an elaboration of my work presented which I will be posting my comments. Certainly the comment on the subject is interesting which I also noted.
QUOTE:
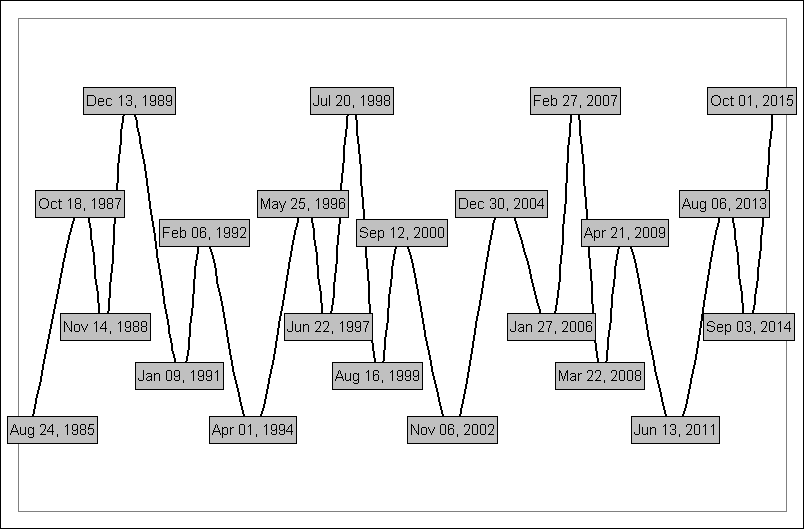
Global Business Cycle, showing economic confidence & activity
It peaked on a relative basis in late December 2004, and is headed down through January 2006. Global economic confidence will turn back up into a major relative peak in early February 2007.
Before you blow this off as just another cycle graph from some analysis cycle nerd, please do look at the relative accuracy. The cycle called a global top in early January 2005, the US stock market bottom in late 2002, the Dow Jones and S&P 500 peak in 2000, the low in gold in mid 1999, the Russia/Brazil/LTCM crises in mid 1998, the Asian crisis bottom in 1997, a very good buy point in US stocks in early 1994 as the hottest part of the move started, and the global peak in late 1989 when Japan and various other financial items peaked. Credit belongs here (more data here). Maybe its too simple... but it works for us to help put things into a broad perspective. Do also note that we're not trying to say that different markets hit peaks and valleys at the same time, just that the cycle helps identify probable major turning points in one or more markets. We used to have a link to Mr. Ed Yardeni's fine site for how oil tied in to the global business cycle, but it has gone private as of late 2006.
Another broad look at where we have been and where we may be going is a Word document from Ian Gordon's site, The Long Wave Analyst. We disagree on his timing since he feels we're in a deflation and headed for much more, but its a valid cyclical outlook.
One last quite good predictive aid is the Baltic Dry Index ( chart link and recent values), a broad measure of worldwide shipping prices - when its going up, many world economies are improving and vice versa.
END of QUOTE
With regard to "McHugh's megaphone crash" work which he presented, as noted on the previous post, he also presented his M3 analysis in the past.
http://www.safehaven.../archive-74.htm
I hope that Dr Bernanke will control the equity market bubble at this juncture instead of further bubbling up since markets are at VLT TL resistances after meeting the breakout targets.
Markets are at major resistances, 86yr TL resistance on DOW and 45yr TL resistances on SPX and NASDAQ ; therefore, we need to be extremely cautious with bullish/bearish sentiment, because bullish bias is still dominant unless the FED Bernanke has a sober mind to control the market to pull back at this juncture.
Thanks and God bless
Edited by Trend-Signals, 28 January 2007 - 02:30 PM.


 which anyone can notice it; but, I think that you are just drawing everyone's attention to the fact that it is rising at astronomical rate. Of course, this is a bit of exaggeration, the astronomical part.
Yes, of course, I love Dr Bernanke even though we all have our weaknesses. He is certainly managing our economy well so that many can benefit from it; even so, we would wonder whether he is not favoring rich folks over average Americans. This is not a simple topic to debate whether tightening monetary policy is better than easy one which is what we are seeing now.
Of course, he is not God who can solve all of problems that we have. Not even God is not solving all problems, but he certainly seems to be favoring Bulls lately for sure.
Not sure whether you are a bull or a bear at this point, but best wishes for you.
which anyone can notice it; but, I think that you are just drawing everyone's attention to the fact that it is rising at astronomical rate. Of course, this is a bit of exaggeration, the astronomical part.
Yes, of course, I love Dr Bernanke even though we all have our weaknesses. He is certainly managing our economy well so that many can benefit from it; even so, we would wonder whether he is not favoring rich folks over average Americans. This is not a simple topic to debate whether tightening monetary policy is better than easy one which is what we are seeing now.
Of course, he is not God who can solve all of problems that we have. Not even God is not solving all problems, but he certainly seems to be favoring Bulls lately for sure.
Not sure whether you are a bull or a bear at this point, but best wishes for you. 


