U.F.O.

You Wanna Go Short
Started by
U.F.O.
, Feb 21 2007 09:59 PM
3 replies to this topic
#1

Posted 21 February 2007 - 09:59 PM
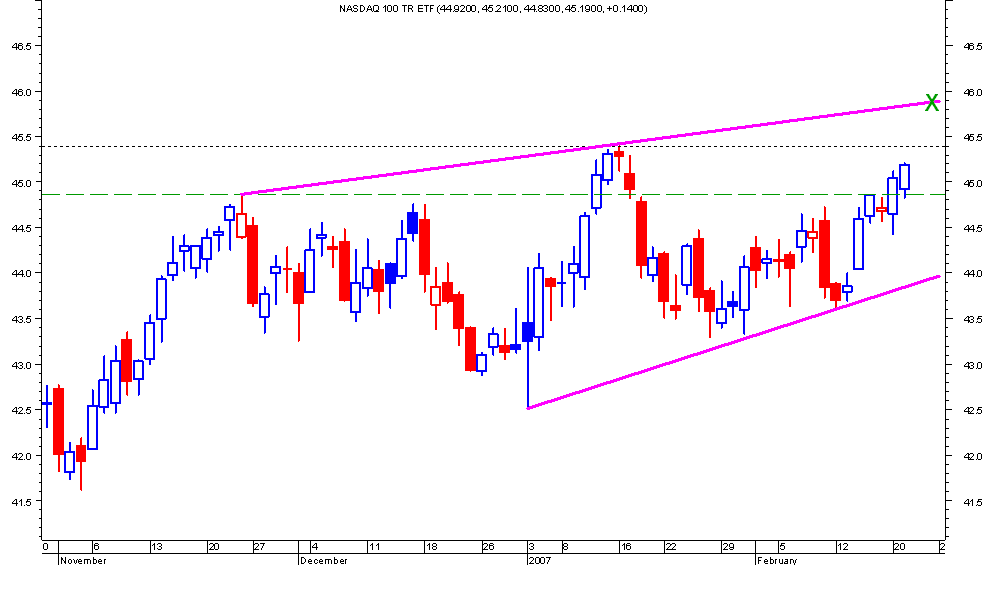
$45.875. New rally high. Top-line resistance. Market overbought. Symmetry. I may join you. (1 chart)
U.F.O.

U.F.O.
"Democracy is two wolves and a lamb voting on what to have for lunch. Liberty is a well-armed lamb contesting the vote!"
~Benjamin Franklin~
~Benjamin Franklin~
#2

Posted 21 February 2007 - 10:47 PM
Hey UFO! Looks like we both got a gal in American Idol. Melinda Doolittle is from Brentwood, TN but went to HS here in Tulsa.

Now. Back to business.
Can you help me see if there is any visible trend here?


Now. Back to business.
Can you help me see if there is any visible trend here?

"Nature's Failure to Function in a 'Predictable Way'... 500 years ago?"
BIGGEST SCIENCE SCANDAL EVER...Official records systematically 'adjusted'.
BIGGEST SCIENCE SCANDAL EVER...Official records systematically 'adjusted'.
#3

Posted 22 February 2007 - 05:55 AM
Nice possible ED in progress lots of FIB#s there. if labeled a b c d e ,$45.875. New rally high. Top-line resistance. Market overbought. Symmetry. I may join you. (1 chart)
U.F.O.
a to c 34 trading days,
b to c 8 TD,s
c to d 13 and 21 TD,s [2 touches]
d to e [today or fri] 8 TD,s
I might give it it a shot myself, of course it could morph into something different.
GOOD LUCK all,
pisces.
#4

Posted 22 February 2007 - 06:52 AM
UFO, in support of a higher high on ndx.....I've mentioned numerous times that my capitulation mark is going to be a few closes (if not a weekly close) above 674/75 OEX. . . .but then I still have that 2001 high of 680 that I'm leary about. I like the idea of a high very early March with a throwover above top TL on this OEX chart which would mean spx in the 1468/70 area. A close above 1462 SPX would guarantee that higher number I think but still have something that says 1462 just "might" hold the upside on a weekly basis.
I'm still bearish IT but I am starting to get the feeling that either we are going to explode to test all time highs on spx or this IT correction is going to be deeper than I originally thought and we are putting on a more substantial top. My downside targets still remain however at 615 maximum and 640 minimum on OEX. Several targets in between but let's see if 640 gets hit first. Reading this back it sounds kind of wishywashy but I think breaking resistance or support paints the picture.
Also posting an OEX weekly and GE chart....the count on GE 30 min. may give us a clue..
http://stockcharts.com/c-sc/sc?s=$OEX&p=D&yr=0&mn=5&dy=21&i=p60602180050&a=91757908&r=1199.png
http://stockcharts.com/c-sc/sc?s=$OEX&p=W&yr=10&mn=0&dy=0&i=p91399792507&a=83876953&r=8413.png
http://stockcharts.c...98224&r=767.png


