Edited by xD&Cox, 23 February 2007 - 08:34 PM.

CBOE P/C flying
Started by
A-ha
, Feb 23 2007 08:24 PM
2 replies to this topic
#1

Posted 23 February 2007 - 08:24 PM
1.4+  8 straight consecutive up months on SPX... I guess someone told you about terminal moves 10 months ago....Now, any retard with a charting service that can provide history of this index knows what is coming next month and there after.
If this is not a repeat of 96, you all going to worship Yogi 9 months later. IF you survive from dip buying of course...
#2

Posted 23 February 2007 - 09:40 PM
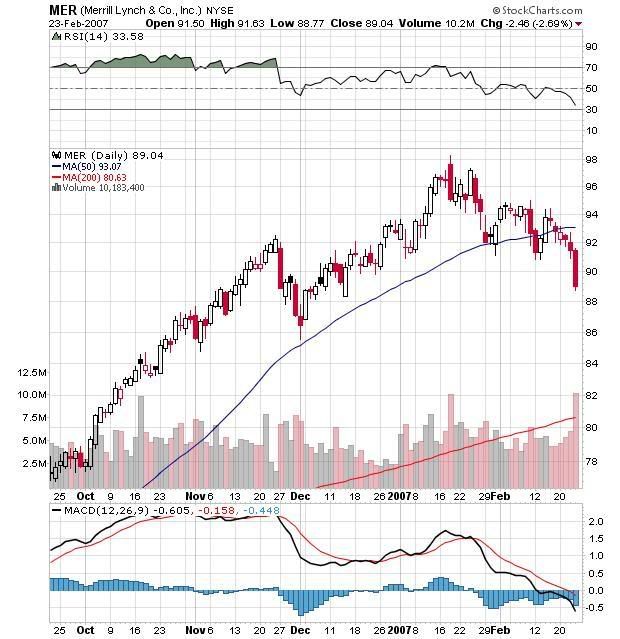
When the cockpit door opens and both the pilot and the co-pilot step out wearing parachutes . . .

Do folks here understand the pivotal role that the Big Dogs on the Street play in the MBS market? Do you know how much they have to lose? Are you paying attention to what's happening with credit default swaps?
The ABX-HE-BBB-07-1 index continued to fall even as the gap between prices at which dealers will buy or sell the contracts reached 5 points, according to Deutsche Bank prices. That means the index would have to drop 5 points for investors betting on a decline to make money.
``Clearly the wide bid-offer spreads are not an incentive; however, it has done little so far to stem the tide of short selling this week,'' DiMartino said. Short selling refers to investors who buy credit protection through the index contracts to bet it will decline.
Credit-default swaps on mortgage bonds offer payments to protection buyers if the securities aren't repaid as expected. Sellers of the contracts are provided monthly payments.
Bloomberg
Da nile is more than a river in Egypt.
#3

Posted 23 February 2007 - 10:06 PM
BKX and XBD getting legs now. But interestingly it is taking place right at the decade long top line seen on 15 year BKX chart.
Historically such corrections produced min %20-%30 sell off. That is as good as the one we have seen during the 2000-2002 bear market.


