
Your guide for the next 5 years
Started by
eminimee
, May 17 2008 04:11 PM
26 replies to this topic
#11

snorkels4
-

- Traders-Talk User
- 2,677 posts
bad guy
Posted 18 May 2008 - 01:11 AM
Andy House, Texas Man, Accidentally Drives 2006 Bugatti Veyron Into Salt Marsh
http://www.zimbio.co...Veyron Crashing
http://www.zimbio.co...Veyron Crashing
#12
arbman
-

- Traders-Talk User
- 19,504 posts
Quant
Posted 18 May 2008 - 01:58 AM
Tea, if I am not on your ignore list, let me tell you my opinion that I think there will be one more high attempt from this break into August in the larger cycles only in respect to the current 90 wk cycle that bottomed in March, but it is hard to say ahead of the break whether it approaches to 1500. I think it is a bye-bye in late 2008 or early 2009 LATEST. The risk taking and the confidence though is quickly rising, but I believe it will drop quickly with a 40-50 points pull back. You will not buy OEX 580 puts for Aug here anyway, will you?!? 
#13
arbman
-
- Traders-Talk User
- 19,504 posts
Quant
Posted 18 May 2008 - 02:01 AM
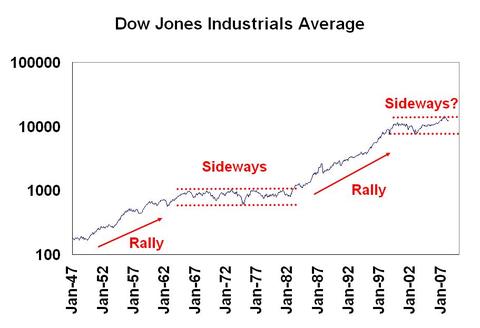
This is an old chart, but the idea here is clear, Fed is willing to inflate to keep the equity prices sideways while the resource prices correct upward...
#14
eminimee
-
- TT Member
- 14,307 posts
I don't care who's fur is flying...
#15
eminimee
-
- TT Member
- 14,307 posts
I don't care who's fur is flying...
Posted 18 May 2008 - 09:57 AM
#16
SemiBizz
-

- Traders-Talk User
- 23,208 posts
Volume Dynamics Specialist
Posted 18 May 2008 - 11:37 AM
IMO your XBD chart implies something more bullish than what I see.
Take a good look at the GS chart...
I have it going to 77 LT.
Wyckoff Wave Chart
Take a good look at the GS chart...
I have it going to 77 LT.
Wyckoff Wave Chart
Edited by SemiBizz, 18 May 2008 - 11:54 AM.
Price and Volume Forensics Specialist
Richard Wyckoff - "Whenever you find hope or fear warping judgment, close out your position"
Volume is the only vote that matters... the ultimate sentiment poll.
http://twitter.com/VolumeDynamics http://parler.com/Volumedynamics
Richard Wyckoff - "Whenever you find hope or fear warping judgment, close out your position"
Volume is the only vote that matters... the ultimate sentiment poll.
http://twitter.com/VolumeDynamics http://parler.com/Volumedynamics
#17
Kimston
-
- Traders-Talk User
- 604 posts
Member
Posted 18 May 2008 - 11:46 AM
Tea,
I always appreciate your great analysis and chart work. The OEX triangle idea seems a good one to have on the radar. Since SP and DJIA don't fit the triangle thesis based on their respective patterns, I was wondering what your bigger picture count is for those indices. It appears the Nas completed 5 waves down from the 07 top, which implies at least another 5 waves down after this corrective rally phase ends. Also wondering what your counts are on gold & silver.
Thanks,
Kimston
#18
marco
-

- Traders-Talk User
- 191 posts
Member
Posted 18 May 2008 - 03:27 PM
Not E-wave, but SPX is the one that looks more like a C&H. And notice the positive RSI divergence in the handle area.

Also, AJTJ from another board likes to use the 180,68 Sto. He notes that tops occur around 80-90. I plotted it here, zooming in more on the handle area. You can see it's nowhere near 80-90. Also note the generally declining volume in the handle.

It all looks bullish to me. But I'm sure Tea can come up with a bearish count.
Also, AJTJ from another board likes to use the 180,68 Sto. He notes that tops occur around 80-90. I plotted it here, zooming in more on the handle area. You can see it's nowhere near 80-90. Also note the generally declining volume in the handle.
It all looks bullish to me. But I'm sure Tea can come up with a bearish count.
#19
pali
-

- Traders-Talk User
- 36 posts
Member
Posted 18 May 2008 - 04:46 PM
HeyTeapartyThe balance of the triangle...consolidation while the consumer tucks some possible savings away while paying off his debt.....and financials take the time to repair the damage after coming completely clean soon.
http://stockcharts.com/c-sc/sc?s=$OEX&p=W&yr=9&mn=6&dy=0&i=p57106758944&a=106691891&r=3882.png
It is courageous of you to stick your neck out with such a long range projection, I compliment you for this.
I usually do not get into the fray, but I would like to add a little bit of market history.According to Stock Traders Almanac the market usually prognosticates who will win the election.If the incumbent party wins the average gain is 18% this is unlikely IMHO,if the challenging party wins the market may end up the year about 4%.Your scheme in general configuration could be correct, but the level at the outcome would need an adjustment.
Cheers

#20
eminimee
-
- TT Member
- 14,307 posts
I don't care who's fur is flying...
Posted 18 May 2008 - 05:27 PM


