Jump to content


Photo

$SPX Hurst Analysis


  • Please log in to reply
67 replies to this topic

#1 SilentOne

SilentOne

    Member

  • Traders-Talk User
  • 3,452 posts

Posted 09 July 2008 - 09:22 PM

I had a look at the FPA once again for the $SPX. I have stuck with Bob's recent phasing and it is starting to make sense. Standing back and looking at this chart with recent action in mind, I conclude el sigma is down. We are sliding into a 9 month or 40 week low which is late at 47 weeks off the mid-Aug. low (bearish right translated low), and we will have a bounce to be followed by a final push into an 80 week low.

If markets right themselves somehow in the coming weeks, this bearish view can change. I'll be trading one way or another and will put buy/hold on hold, most likely for some time to come.

At the beginning of this year I anticipated the Jan. and March lows, but I did not foresee this terribly weak summer. Looking at the 10 year weekly chart, one can see the double top formed late last year and its bearish implications. Had I sensed this major change of trend, I would have closed all long term core positions. We are still very liquid though with plenty of capital for opportunities as they present themselves.

Posted Image

cheers,

john
"By the Law of Periodical Repetition, everything which has happened once must happen again and again and again-and not capriciously, but at regular periods, and each thing in its own period, not another's, and each obeying its own law ..." - Mark Twain

#2 SilentOne

SilentOne

    Member

  • Traders-Talk User
  • 3,452 posts

Posted 09 November 2008 - 01:25 AM

Test driving some charting software. I have drawn in the nominal 9 and 18 month cycles as well as 4.5 year lows. Note the emphasis on nominal. Price does not necessarily have to print a cycle low at the nominal cycle lows, although you'd expect some confluence at major lows such as the 4.5 year cycle.

This does not present a pretty picture. I was bearish when the $SPX cut to new lows in the summer. Now we have to factor in the huge price decline combined with the fact that the next 4.5 year lows are 2.5 - 3 years away. This bear market is ... well, just really bad.

I have stuck with Bob's original phasing, but I will also try a slight deviation in my next post. Here is a replication of the phasing as posted in July.

Posted Image

cheers,

john

Edited by SilentOne, 09 November 2008 - 01:33 AM.

"By the Law of Periodical Repetition, everything which has happened once must happen again and again and again-and not capriciously, but at regular periods, and each thing in its own period, not another's, and each obeying its own law ..." - Mark Twain

#3 SilentOne

SilentOne

    Member

  • Traders-Talk User
  • 3,452 posts

Posted 09 November 2008 - 02:13 AM

If I look at shorter term phasing for the 20, 40, and 80 week cycles, visually I'm compelled to work off the summer 2006 low. This might not be the strict nominal lows as shown in the previous post, but the amplitudes of the 40 and 80 week cycles seem to agree with this phasing. Anyway, this is what it looks like. It would support a bear rally here off the Oct. lows or another new low into a 20 and 40 week low which would then be bullish for a multi-week bear rally. When I look at other assets, particularly commodities, this would make some sense. No way to be sure other than to keep searching for signs that the bears may lose control here for a while.

So this phasing supports an imminent bear rally, but then the bears would regain control next year for a slide into an 18 month (80 week) cycle low.

Posted Image

cheers,

john

Edited by SilentOne, 09 November 2008 - 02:20 AM.

"By the Law of Periodical Repetition, everything which has happened once must happen again and again and again-and not capriciously, but at regular periods, and each thing in its own period, not another's, and each obeying its own law ..." - Mark Twain

#4 SilentOne

SilentOne

    Member

  • Traders-Talk User
  • 3,452 posts

Posted 02 February 2009 - 09:10 AM

Price action is not consistent with an 80 week low. Thus I have to assume it has not arrived yet. The $SPX failed miserably as it rolled off its FLDs (2.5, 5, 10, and 20 week). So this market is headed for its lows no doubt. The more difficult question is when will an 80 week low make its turn. And when it occurs you'll know, trust me.

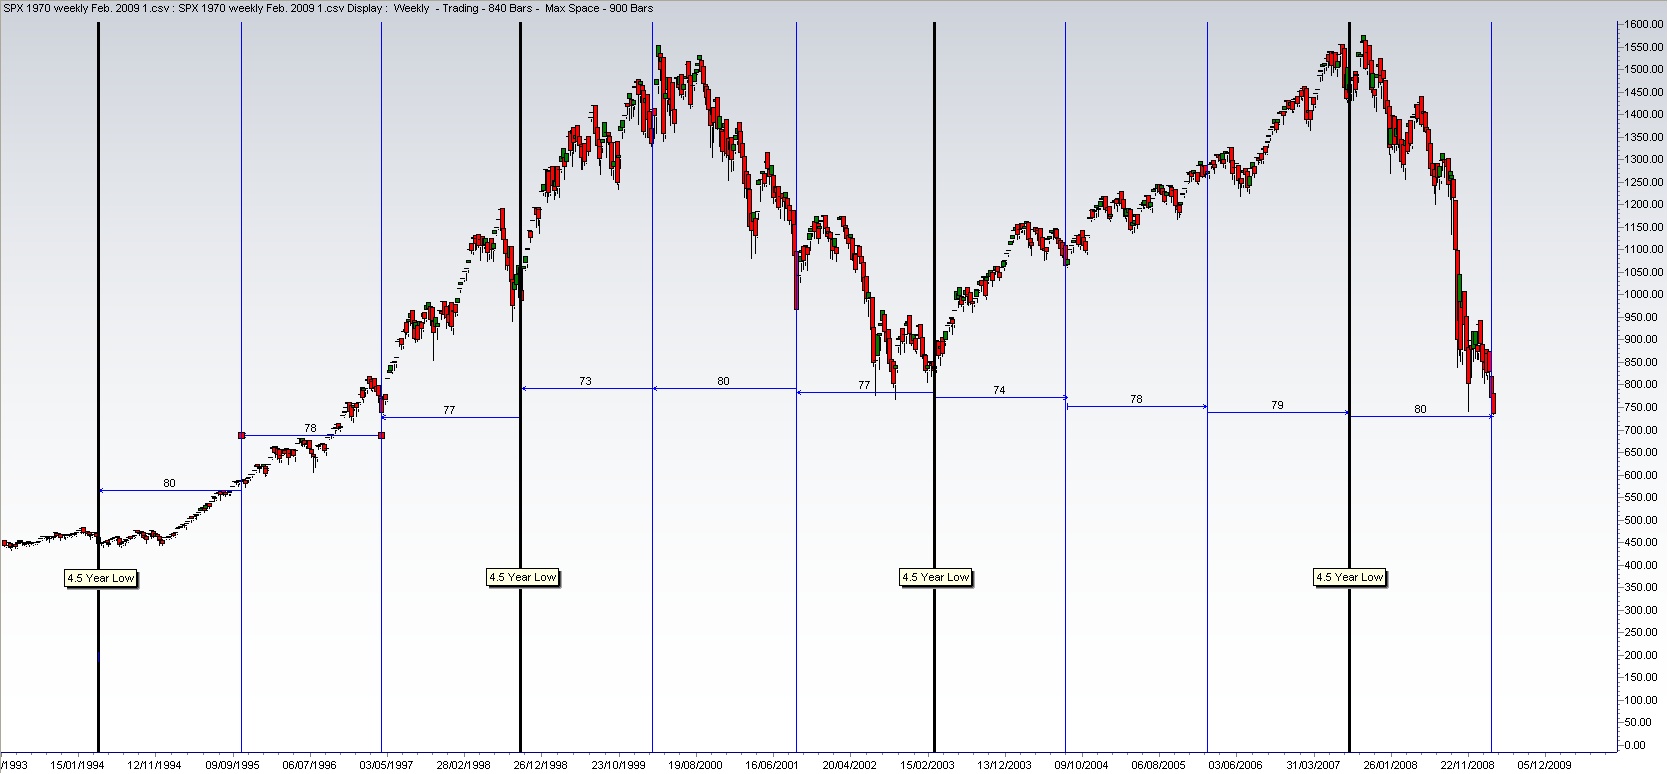
This is Bob's original phasing for the 80 week cycle (18 month) and points to a low possibly late Feb./early March. There are some other aspects that point to March 6th at the moment, but that is merely a guess at this point. The 80 week will be good to what +/- 4 weeks but will extend in time due to the very large cycles involved? So could extend to mid-April. Avg. cycle length is 79 weeks for the last 13 counted here (assuming the cycles are accurately counted of course).

What bugs me is the "extra" 80 week cycle we seem to be looking at here for 1987. And I just can't see how a market can top virtually at a 4.5 year low (ie. black vertical lines are 4.5 year cycle lows). From 10,000 feet that is what it looks like. AND if that is correct that the 4.5 year low came in Aug., 2007 near the all-time high, then timewise this bear is going to be really painful, never mind price. I think I have repeated myself more than once on this, but those are the facts.

Once the 80 week low is in we will see a terrific rally, probably one of the best of this bear market.

Posted Image

cheers,

john

Edited by SilentOne, 02 February 2009 - 09:17 AM.

"By the Law of Periodical Repetition, everything which has happened once must happen again and again and again-and not capriciously, but at regular periods, and each thing in its own period, not another's, and each obeying its own law ..." - Mark Twain

#5 mss

mss

    I'M WATCHING

  • TT Sponsor
  • 6,182 posts

Posted 02 February 2009 - 04:22 PM

:)

And I just can't see how a market can top virtually at a 4.5 year low (ie. black vertical lines are 4.5 year cycle lows).


John, this is when my private indicators stated going down instead of up even as price proceeded upward the indicators went further down. I almost gave up on them but 15 years of good results sent a warning sign up and I did not ignore.
Some of my way-back post bear this out. As you say, time will tell, but I think 600 SPX is a given, just when-------------
Best to you Scott
WOMEN & CATS WILL DO AS THEY PLEASE, AND MEN & DOGS SHOULD GET USED TO THE IDEA.
A DOG ALWAYS OFFERS UNCONDITIONAL LOVE. CATS HAVE TO THINK ABOUT IT!!

#6 SilentOne

SilentOne

    Member

  • Traders-Talk User
  • 3,452 posts

Posted 02 February 2009 - 04:35 PM

hi Scott,

John, this is when my private indicators stated going down instead of up even as price proceeded upward the indicators went further down. I almost gave up on them but 15 years of good results sent a warning sign up and I did not ignore.
Some of my way-back post bear this out. As you say, time will tell, but I think 600 SPX is a given, just when-------------


Thanks for the comment. Yes, I remember your early interpretation of the $SPX price action. It proved itself over and over in the last year. If there is one weakness of cycle work, it is that you can get caught out at significant turns. I have done a better job interpreting/anticipating the turns for oil, precious metals, or currencies over the last 2 years, but I was fooled in the $SPX price action. So was Bob and the reason was simply that the 4.5 year cycle low came in so close to when the $SPX crested to all-time highs. I should have had a closer eye on the 18 and 36 year cycles as these are what have come into play. Had I sensed that the longer term cycles (and the sum of all cycles - also known as sigma el to Hurst followers) would turn so hard, then the only interpretation could have been a bearish one. As you can see at the start of this thread, it took me until mid-summer last year to realize what was happening.

Good trading to you. Forget about the investing part. The only "investing" one can seem to do these days is to "invest" in yourself (by that I mean get better at dealing with these markets).

cheers,

john

Edited by SilentOne, 02 February 2009 - 04:40 PM.

"By the Law of Periodical Repetition, everything which has happened once must happen again and again and again-and not capriciously, but at regular periods, and each thing in its own period, not another's, and each obeying its own law ..." - Mark Twain

#7 SilentOne

SilentOne

    Member

  • Traders-Talk User
  • 3,452 posts

Posted 05 February 2009 - 08:58 PM

Possible upside targets (although modest) generated with the 2.5 and 5 week FLDs. The 20 week FLD (not shown) coming into play again this week. The 10 week FLD is above 900 and is about to start falling. $SPX was parked right below the trendline today.

Posted Image

This should be interesting. Is this thing going to rally just enough to hang itself?

I think the swing vote goes to oil. If crude rallies here like it has printed THE LOW for 2009, then this is for real (ie. best bear rally of the year starts right here).

cheers,

john
"By the Law of Periodical Repetition, everything which has happened once must happen again and again and again-and not capriciously, but at regular periods, and each thing in its own period, not another's, and each obeying its own law ..." - Mark Twain

#8 Echo

Echo

    Member

  • Traders-Talk User
  • 2,273 posts

Posted 05 February 2009 - 11:03 PM

John, While we closed above the 2.5wk fld, the midpoint of today's bar actually crossed UNDER for a double cross to the downside (the first one being on Monday). Hurst said you could take the average of both for downside targets. We are likely to remain under the fld (barring a huge upday tomor as the fld will jump to 861.79. From today's close, we'd have to close at 877 to have an upcross of the midpoint, unless, of course, we get a nice gap up. I think the bigger thing to keep an eye on is the 80wk low due very soon. Also, if you are using 7 days for the 2.5wk fld, why not use at least 13 days, if not 14 days for the 5wk fld. I think the recent cycles have been running closer to 14 days... Echo

#9 SilentOne

SilentOne

    Member

  • Traders-Talk User
  • 3,452 posts

Posted 06 February 2009 - 09:25 AM

hi echo, Thanks for your comments. Its nice to have a Hurst technician here. I agree that the cycles are stretched out a bit more in this bear as would be expected so that FLDs should be adjusted to reflect that. I just threw up my standard 7, 12, and 24 settings for the 2.5, 5 and 10 week cycles. The position of the FLDs is not encouraging for a significant rally as I mentioned. The position of the 5 week is too low and as someone on another pointed out, the FLDs are not setup in a true cascade position (ie. compressed one on top the other). It would not surprise me if the $SPX rally a bit more here to test the trendline, but ultimately it appears like it will fail. I look over to crude right now and it seems to be leading the move lower. Probably the only thing holding things up here is Geitner's speech on Monday. cheers, john

Edited by SilentOne, 06 February 2009 - 09:25 AM.

"By the Law of Periodical Repetition, everything which has happened once must happen again and again and again-and not capriciously, but at regular periods, and each thing in its own period, not another's, and each obeying its own law ..." - Mark Twain

#10 SilentOne

SilentOne

    Member

  • Traders-Talk User
  • 3,452 posts

Posted 28 February 2009 - 06:22 PM

SPX_weekly_80_wk_cycles_4.5_yr_lows_Feb._2009.jpg
"By the Law of Periodical Repetition, everything which has happened once must happen again and again and again-and not capriciously, but at regular periods, and each thing in its own period, not another's, and each obeying its own law ..." - Mark Twain