Jump to content


Photo

Market Direction? We're Being Chumped.


  • Please log in to reply
37 replies to this topic

#1 U.F.O.

U.F.O.

    U.F.O.

  • TT Patron+
  • 5,605 posts

Posted 15 August 2008 - 10:49 PM

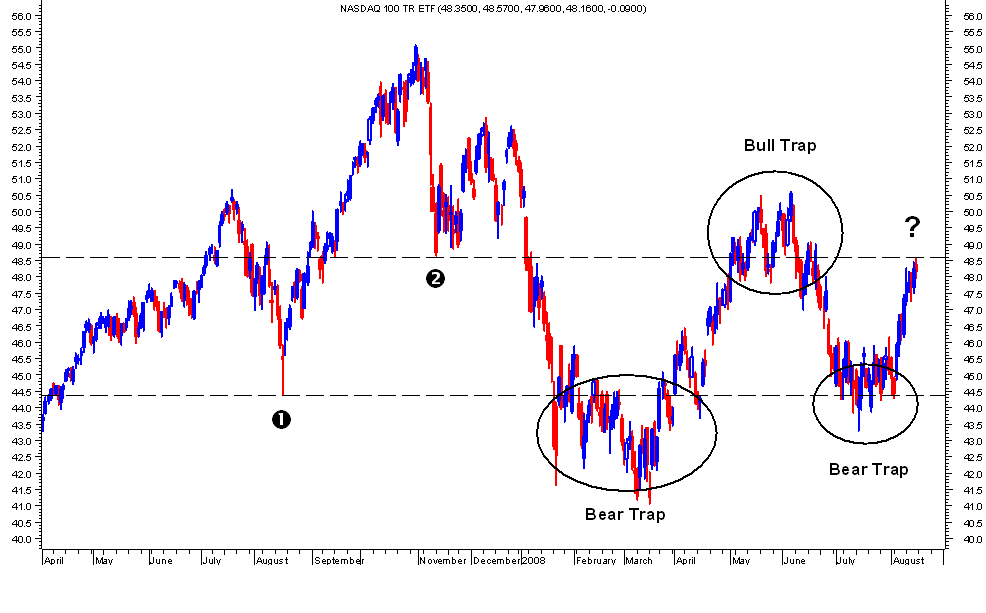
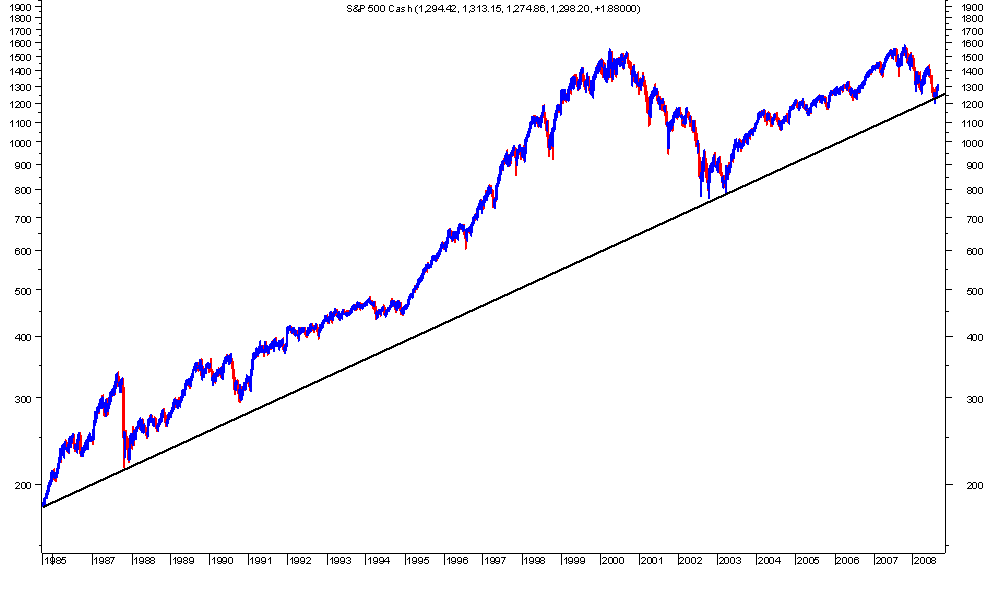
This post is a long time in the making. I've wondered for a long, long time why the country can undergo recessions, S & L crises, wars, dot-com busts, housing collapses and anything else you can throw at it and the semi-log $SPX weekly chart has never broken the LLT (long-long term) uptrend line decisively. (chart #1) Sure, it bent...once. In July 2008, but in the 23 years my Metastock allows me to chart it, 99.9% of the price activity has remained above the uptrend line. I think this uptrend line goes back even further than that. Does that seem odd to anyone else but me? We're in the middle of the biggest financial crisis in 20 years and the best we can do is "bend" the LLT uptrend line? So, what's going on here? I've never believed much in conspiracy theory. I've always believed it originated from insecure, defensive individuals who have an axe to grind. And I really don't think the word "conspiracy" actually applies here. I'd like to think of the LLT $SPX uptrend line more as "the minimum advancing slope necessary to maintain the existence of capitalism." That's a mouthful. But I believe it has merit. What exactly is capitalism? Better still, what is the poster child of capitalism? The stock market. Plain and simple. IF the stock market were to fail miserably for 10 or 15 years what would happen to our pension funds, 401k's, society in general? Total economic collapse would be the payoff. It hasn't happened. Every time we have a stock market crash (1987-1990-2000-2007) where do we stop? The uptrend line. So, my 1st point tonight is that betting on a total collapse that takes us through the $SPX LLT uptrend line for more than a short trip is suicidal. It's never happened. The lottery pays as well. Is this because of some PPT or Goldman Sachs etc. intervention? Probably not. Most likely this inflection point is as natural as the seasons and just as powerful. If we can get our heads around that simple fact, the next question is what happens when we have hit or moderately exceeded this point of no penetration? Recently we exceeded it in the space of one week and bounced back into the uptrend channel. There doesn't really seem to be any good reason here for a rally. Hence a new concept..."marking time". How does a market trade when it's actually gone as low as it can, realistically, but a rally isn't quite yet on the horizon? Like a sine wave, sucking in shorts at the lows and longs at the highs. (chart #2) is the QQQQ daily. I present to you a "sine wave" effect and the traps within. #1 and #2 represent previous high volume lows that seem to define the channel of the price action to this point. Thx. for reading my babble on a Friday night and everyone have a great weekend! (2 charts)

U.F.O.
Posted Image

Posted Image

Edited by U.F.O., 15 August 2008 - 10:53 PM.

"Democracy is two wolves and a lamb voting on what to have for lunch. Liberty is a well-armed lamb contesting the vote!"
~Benjamin Franklin~

#2 dcengr

dcengr

    Member

  • Traders-Talk User
  • 13,391 posts

Posted 15 August 2008 - 11:57 PM

Babble is the right word for it. The concert's still going on and the fat lady's not even warmed up yet. Anything can happen.. it can go right below that line, it can bounce off and head upwards for years. Those who believe in cycles would do well, however, to study history. There are secular bear markets (ie 70s) that last for decades. There are secular bull markets that last for decades. The question is, did we end a secular bull or not? You are only going to know this in hindsight for sure. If it goes sideways for a few years, I'm inclined to say yes. But by that time, secular bear may end. Here's something I do know: 1) Everything returns to the norm (so take a longer trendline) 2) Only the few get wealthy This is pretty much 99% of my system in one form or another. That's all I need to know to trade the markets.
Qui custodiet ipsos custodes?

#3 Drano

Drano

    Member

  • Traders-Talk User
  • 481 posts

Posted 16 August 2008 - 12:27 AM

Part of that relentless uptrend is because of the "re-balancing" of the index that weeds out the crap and replaces it with the current darlings. It would be interesting to look at the SPX constituents from, say, 30 years ago, and see what would happen to that trendline if all of those stocks -- including the ones that collapsed into bankruptcy -- were used to get the index values. Hello, Enron?

#4 Gary Smith

Gary Smith

    Member

  • Traders-Talk User
  • 887 posts

Posted 16 August 2008 - 05:23 AM

Part of that relentless uptrend is because of the "re-balancing" of the index that weeds out the crap and replaces it with the current darlings. It would be interesting to look at the SPX constituents from, say, 30 years ago, and see what would happen to that trendline if all of those stocks -- including the ones that collapsed into bankruptcy -- were used to get the index values. Hello, Enron?


Actually, the opposite is the case. Jeremy Siegel in his book The Future for Investors has *exhaustive* research on holding the original stocks in the S&P 500 and found that the returns beat the returns on the standard, continually updated S&P Index and did so with lower risk. And that in spite of the fact some 30 of the original index eventually went bankrupt. I haven't seen any research on the Dow but doubt it's much different. The so-called current darlings underperform after they are added to the index ( example is the tech stocks added just before the tech crash) and the ones deleted tend to outperform.

#5 eminimee

eminimee

    I don't care who's fur is flying...

  • TT Member
  • 14,307 posts

Posted 16 August 2008 - 07:11 AM

My take...I love playing with long term charts....and here's a TL that I think gets hit and very few realize how it played a part at the 2002 and 2003 lows...This is log scale..
http://stockcharts.com/c-sc/sc?s=$SPX&p=M&st=1980-01-01&i=p00449385827&a=90720826&r=4055.png

#6 eminimee

eminimee

    I don't care who's fur is flying...

  • TT Member
  • 14,307 posts

Posted 16 August 2008 - 08:09 AM

http://stockcharts.com/c-sc/sc?s=$INDU&p=M&st=1980-01-01&i=p07120552474&a=119376310&r=2274.png

http://stockcharts.com/c-sc/sc?s=$OEX&p=M&st=1980-01-01&i=p11228584389&a=119372683&r=5365.png

#7 HoseB

HoseB

    Member

  • Traders-Talk User
  • 1,061 posts

Posted 16 August 2008 - 08:22 AM

The Fed has been MASHING THE GAS VIRTUALLY NON STOP since the last real recession... ending in 1982. Prior to that time, the Fed created "cycles" in the economy by alternatively easing and restricting rates and money supply. But since '82, it has been non-stop money pumping. What about the inflation it causes? Now they just lie about it. The big trend-up pattern may get blown away when the world acknowledges the USA has suffered a "credit exhaustion" [self inflicted] and the house of cards falls.
40,000 headmen couldn't make me change my mind....

#8 ogm

ogm

    Member

  • Traders-Talk User
  • 13,780 posts

Posted 16 August 2008 - 08:30 AM

The Fed has been MASHING THE GAS VIRTUALLY NON STOP since the last real recession... ending in 1982. Prior to that time, the Fed created "cycles" in the economy by alternatively easing and restricting rates and money supply. But since '82, it has been non-stop money pumping. What about the inflation it causes? Now they just lie about it.

The big trend-up pattern may get blown away when the world acknowledges the USA has suffered a "credit exhaustion" [self inflicted] and the house of cards falls.


Exactly. The credit bubble 20 years in the making was fueling that 20 year uptrend. Now the credit bubble is poping. What makes anyone think that uptrend holds ?

And as TP pointed out, its already broken.

#9 traderpaul

traderpaul

    Member

  • Traders-Talk User
  • 6,034 posts

Posted 16 August 2008 - 08:46 AM

The long term chart looks great but one has to look closer......If you brought at the 2000 peak, you still have a loss.......If one put the money in a CD at the peak (2000), he/she is doing much better than the market.....$1000 investment in a CD at 5% compounded=$1477 compounded in eight years vs a loss of 15% in the S&P in eight years....If we add inflation to those figures....The gain does not seem that big after all....
"Inflation is taking place now. Prices may not appear to be rising because they are making packaging smaller. "— Rickoshay

#10 TMN

TMN

    Member

  • Traders-Talk User
  • 1,174 posts

Posted 16 August 2008 - 08:53 AM

i agree, with ogm, tp and HoseB. the fed knew last year that the game was over. all they could do for the banks/brokers was buy them some time. some will make it some will fail. what's the problem with that?