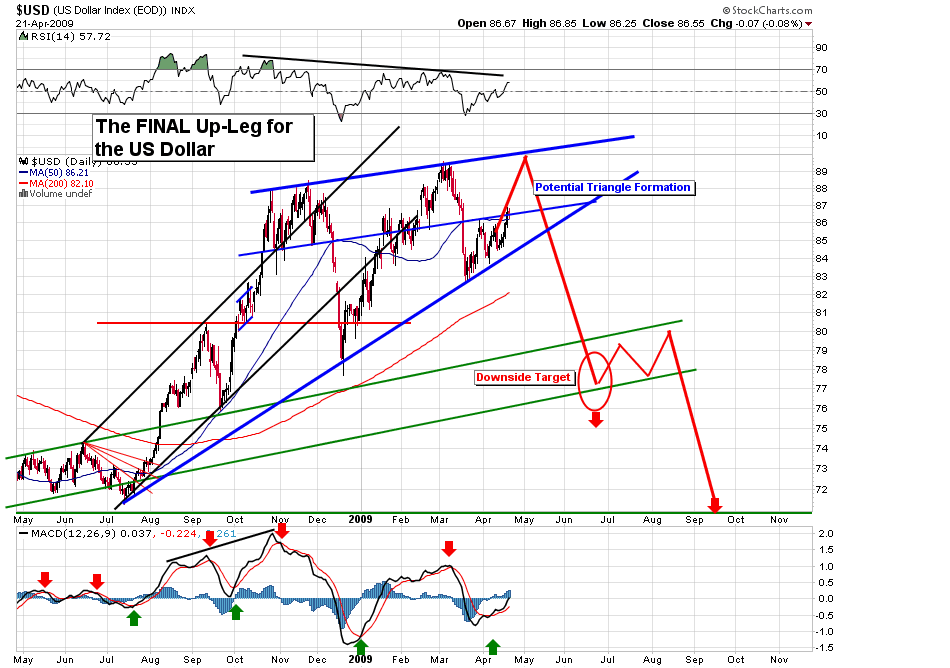
Here is a current $USD chart showing what could be a possible ABCDE correction, if so we go back to to the recent highs in the gold sector.......
Pardon the annotations, first time I ever try that!....
http://stockcharts.com/h-sc/ui?s=$USD...&a=85082958
Goldswinger.

$USD chart ABCDE correction?
Started by
goldswinger
, Apr 20 2009 02:01 AM
7 replies to this topic
#2

shanabe
-

- Traders-Talk User
- 152 posts
Member
Posted 20 April 2009 - 07:33 PM
interesting idea...I took a flyer on UDN recently and am about 2% underwater...tolerable for a small position...but I'd like to get it back as my stop isn't all that far away. I'm probably too early on the USD devaluation play from what I've been reading. Best house in a bad neighborhood is still the rule.Here is a current $USD chart showing what could be a possible ABCDE correction, if so we go back to to the recent highs in the gold sector.......
Pardon the annotations, first time I ever try that!....
http://stockcharts.com/h-sc/ui?s=$USD...&a=85082958
Goldswinger.
In Ponzi We Trust
#3
goldswinger
-
- Traders-Talk User
- 2,612 posts
Member
Posted 20 April 2009 - 11:29 PM
I just looked at the $USD 60 min indicators, looks like it needs a bit more on the up side to complete that wave up and it is down after that.!!!
Not sure how much but I would hang in if I were you .......
Goldswinger.
#4
diogenes227
-

- TT Patron+
- 5,120 posts
Member
Posted 21 April 2009 - 12:16 AM
Lows above lows on that stochastic, no highs below highs, so the dollar's probably going higher.
And if the trend line holds, maybe for a long, long time.
http://stockcharts.com/c-sc/sc?s=$USD&p=D&yr=0&mn=10&dy=0&i=p36275414600&a=156099816&r=1966.png
And if the trend line holds, maybe for a long, long time.
http://stockcharts.com/c-sc/sc?s=$USD&p=D&yr=0&mn=10&dy=0&i=p36275414600&a=156099816&r=1966.png
"If you've heard this story before, don't stop me because I'd like to hear it again," Groucho Marx (on market history?).
“I've learned in options trading simple is best and the obvious is often the most elusive to recognize.”
"The god of trading rewards persistence, experience and discipline, and absolutely nothing else."
#5
goldswinger
-
- Traders-Talk User
- 2,612 posts
Member
Posted 21 April 2009 - 01:02 AM
I agree with you on that, although the 60 min trend appears to be ending perhaps as early as Tomorrow AM.
I did say possible abcde, we'll see how far down it goes when the 60 MIN rolls over...... If the uptrend is violated, it does not mean it could not go higher just that we maybe in a more serious correction down.... that's all
I am also watching the Euro , a break down of 128.5 means $USD will go higher and both the EURO and GOLD will sink deep....
Goldswinger.
#6
pcosta4
-

- Traders-Talk User
- 5 posts
Member
Posted 21 April 2009 - 06:13 AM
USD also looks like it broke an ascending triangle and could go to 89
#7
stubaby
-

- Traders-Talk User
- 1,694 posts
Member
Posted 21 April 2009 - 09:06 PM
USD also looks like it broke an ascending triangle and could go to 89
I agree
stubaby
#8
goldswinger
-
- Traders-Talk User
- 2,612 posts
Member
Posted 21 April 2009 - 11:15 PM
It could revert down, right here and now as in Tomorrow after a quick spike. I would pay more attention to the declining tops line on the RSI than any other line in your chart, it is my belief it will revert down b4 we get to the 89-90 level. Besides the RSI resistance, my 60 MIN indicators are about to roll over........
We'll see what Tomorrow brings......coincidentally GOLD is about to get out of the gate as well which would support the $USD rolling over.
Goldswinger.
i


