
- The Celestial Winter to Eternal Spring
photos:
Winter: http://farm3.static....21a9b089d_o.jpg
Spring: http://home.comcast....lis_Road_01.jpg
Spring: http://farm1.static....7579b6aa9_o.jpg
photo creditor: L1 L2 L3
January outlook in essence
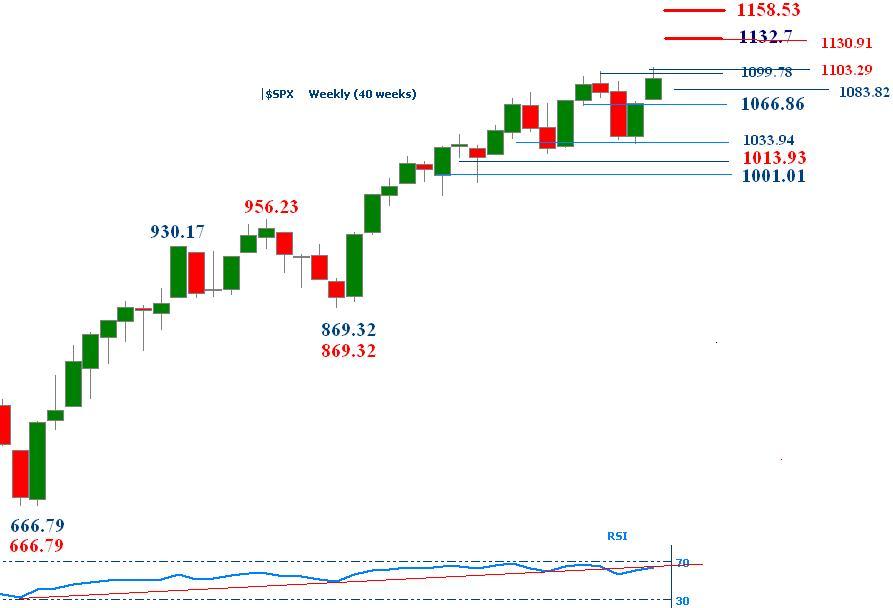
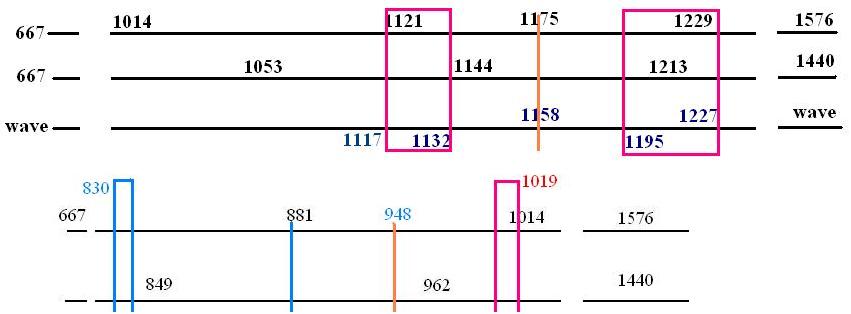
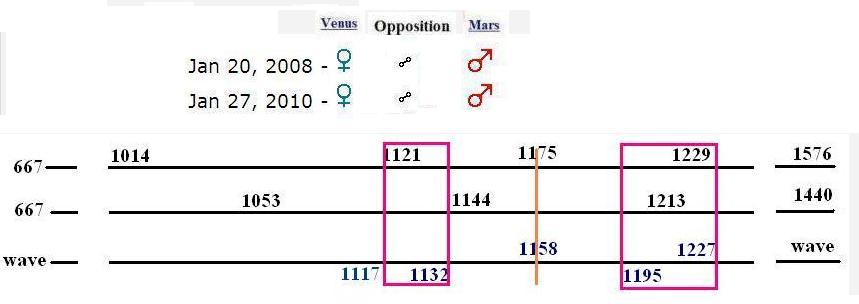
SPX 1158 is an unrealized wave target (1158-1175). The resistance is 1132, 1144. The first line support moves up to 1103, then 1090, and 1064. The near term pivot is 1117
In retrospective mode
On 12/09, index plotted the monthly low 1,085.89 then reversed up. On 12/28-29, index marked the yearly high 1130.38.
--------------------------------------------------------------------------------
December outlook in essence
This month is a transitional period. Index may jog in between the two important clusters 1083-1132 and 1034-1066. When index penetrates the inter pivots 1082 and 1074, it may find support around 1046-1048, and therefore, establishes a new round of assault. Critical support is 1000-1014 with pivot 1019. Resistance is 1116/1117 with pivot 1007-1009.
--------------------------------------------------------------------------------
Probe the Q1 /2010
The turn date on 03/01 is sandwiched by 01/18/10 (Fibonacci Time Zone 0.618) and 04/13/10 (long PI date), the index action in this period provide a good perception for the rest of the 2010. By that time, we may feel the beginning of something. The prelude for the alignment of our times; The key zone to watch is 1014-1001 and 948-962.
Insert: Link to The Grand Cross and An Alignment for Our Times, 10/24/09

Fibonacci retracements & Wave projections
In the chart shown below, the 0.5 movement of [666.79-->956.23] on top of 869.32 is 1014, a 1.0 movement put wave at 1159. on wave extension, 1.236 put index at 1227. coincidently, 1227 overlaps with the 0.618 retracement out of [667:1576] at 1229.
The movements has some traceable trails. Thus, 0.809 out of [1158.76:1014.04] is 1131 and 1.0/0.809 =1.236. The high marked on 12/28,29 is 1130.38. So, the index movement deployed a ratio 0.809 (> 0.786) that gave the speculators an elusive hint.
Nov 14
666.79-->956.23-->869.32-->1158.53 [1.0]-->1227.07 [1.236]
Nov 28
From the FIB map shown below, the next down leg may encounter tough support zone in the range from 948 to 962.
Fibonacci Time Zone ratio 0.618
From 10/11/07 (1576.09) to 03/06/09 (666.79), there were 352 trading days.
Use ratio 0.618, 352 * 0.618 = 218 trading days, it is due on January 15-18, 2010. This particular Time Zone ratio could give a good hint where is the broad direction heads to.
01/15-18/10
Long PI dates [ refer to archive ( 1 ) ]
04/13/10
09/17/10
Astro
Bradley turn dates - http://forbestadvice...nDates2010.html
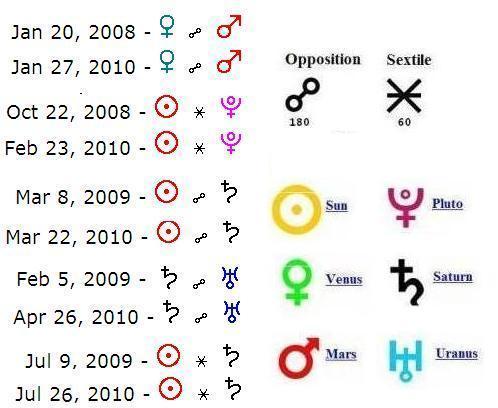
Due to the leading/lagging phenomenon, those secondary Bradley turn dates before/after the important turn date may not be ignored. An good example occurred in the late spring, 01/20-21, 02/8-9 were two secondary turn dates. It was till March 06 index marked a middle term low 666.79.
03/01/10
08/10/10
Saturn-Uranus opposition- http://www.astrology...turnuranus.html
04/26/10
07/23/10
The Crosses of Summer, 2010 - http://www.hermes3.net/2010.htm
07/30/10 T-Cross
08/06 /10 Grand Cross
(partial list)
Archive 2009
[1] Nov 28 2009, 11:51 PM
SPX monthly outlook, December 2009 - snowflakes spinning in the wind
http://www.traders-t...?...st&p=495227
[2] Oct 30 2009, 06:54 AM
SPX monthly outlook, November 2009 - Rhapsody of November
http://www.traders-t...?...st&p=490051
[3] Sep 27 2009, 03:49 PM
SPX monthly outlook, October 2009 The Hunt for Red October
http://www.traders-t...?...st&p=484713
[4] Sep 7 2009, 01:46 PM Sep 5 2009, 10:44 AM
SPX monthly outlook, September 2009 - Vivid September
http://www.traders-t...?...st&p=481638
Key quotes:
Sep 7 2009, 01:46 PM [4]
the wave structure since March low looks bullish.
I speculate there is a possibility we will see the Up wave bring the index to somewhere around 1122 to 1229
Oct 14 2009, 11:56 AM [3]
The overall wave looks bullish, the best outcome for bears is a consolidation process. Crash is a rare event. A very preliminary view for the next few months: If the pullback is not lower than 1034-1066, index might challenge 1158, and then 1229. There is some tough work for both bulls/bears in the range 1083-1132. The lower range support is 1000-1014 and 960


