

Member
Posted 31 January 2010 - 12:04 AM
bad guy

Posted 31 January 2010 - 12:57 PM
bottoms alot clearer than tops. i wonder if gold would be different on long term chart.I have been obsessive in my view about July 5-8th 2013 as a major low and yes I am looking through Aussie eyes.
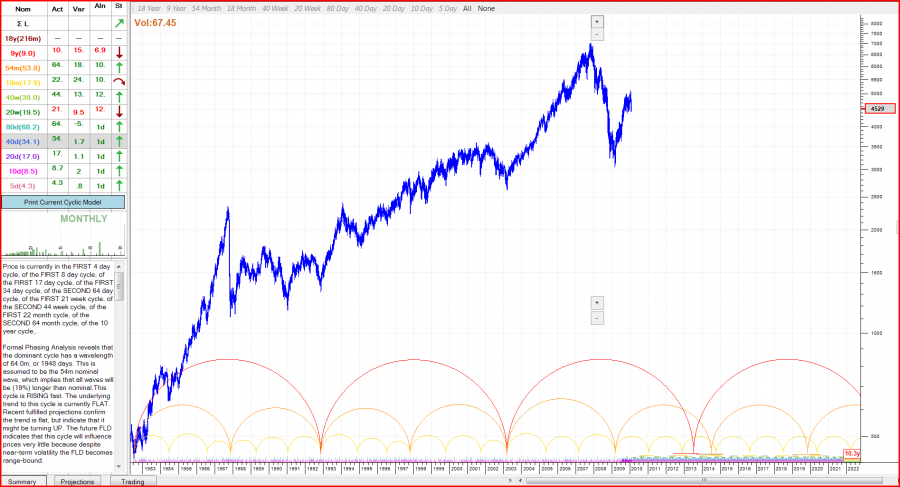
The first chart (Aussie market) which I have never seen before (with this software) today is based on Hurst modelling. Although it suggests the dominate cycle is 64 months when I think it is 62 months, it produces a low of July 14 2013 just a week later than my projected date.
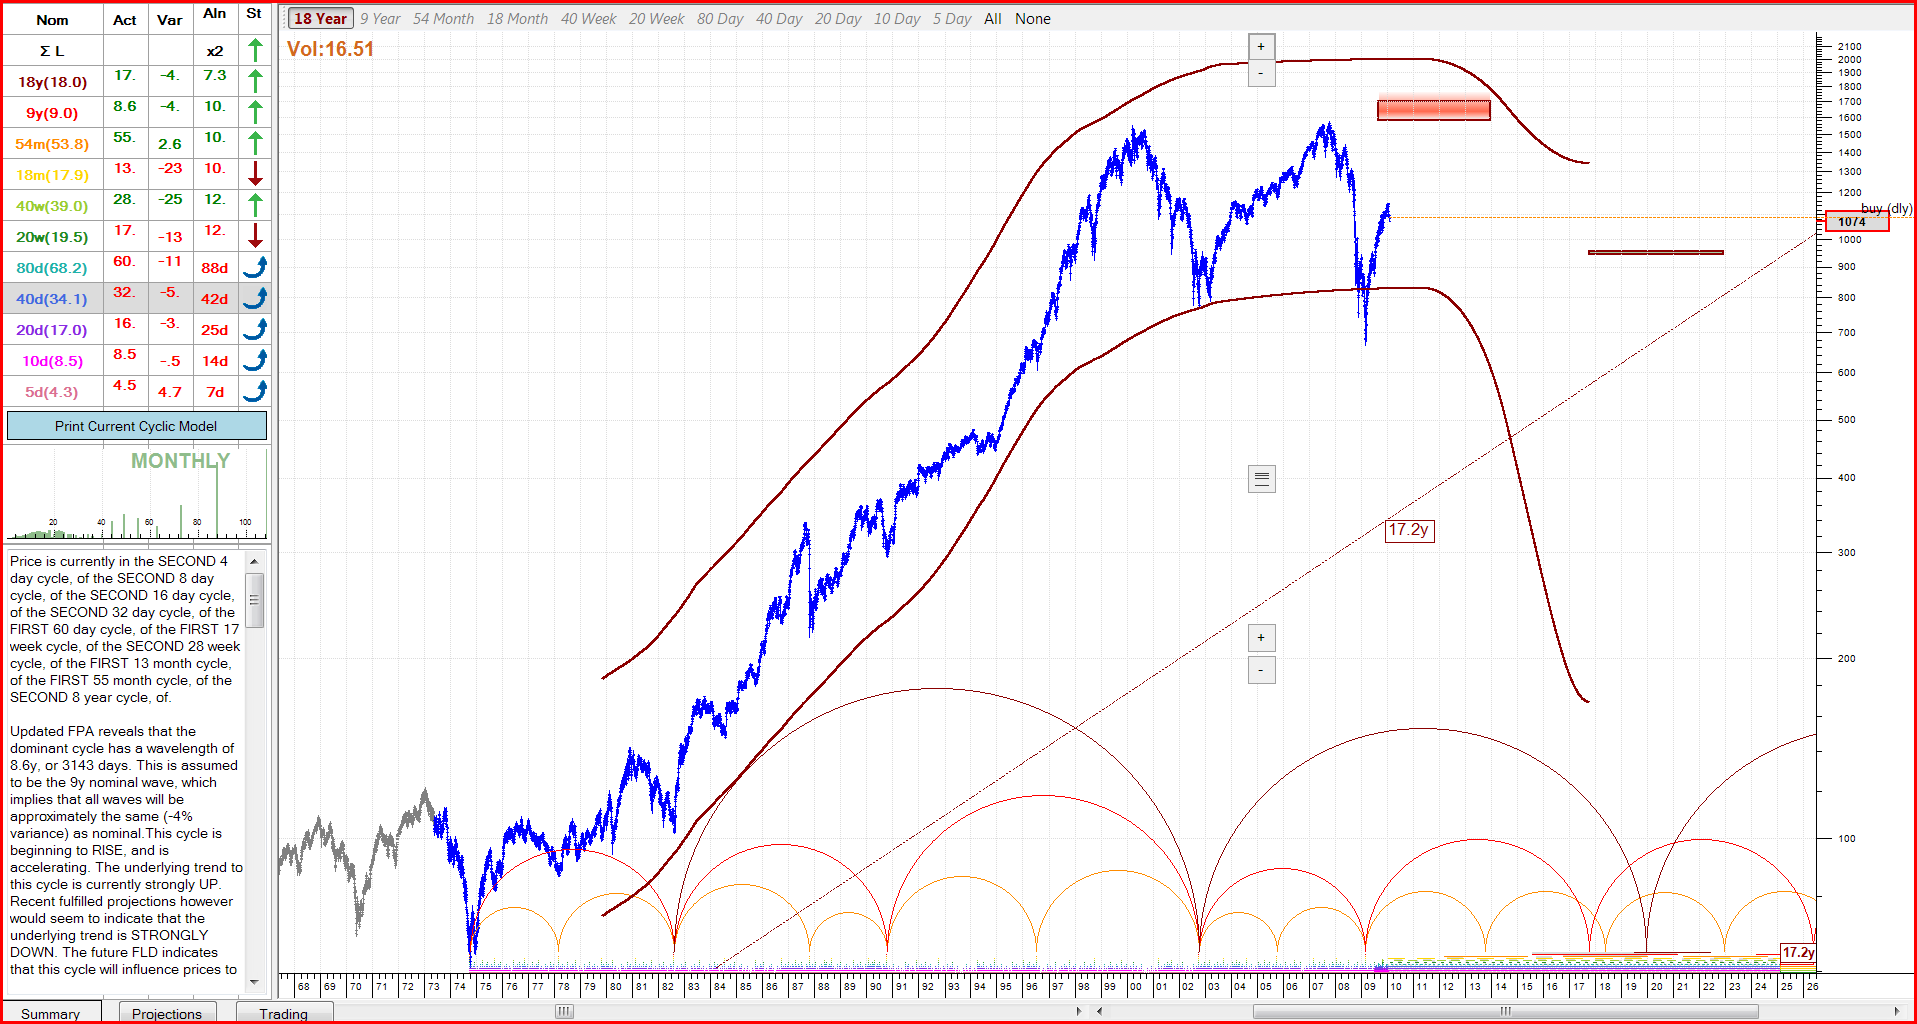
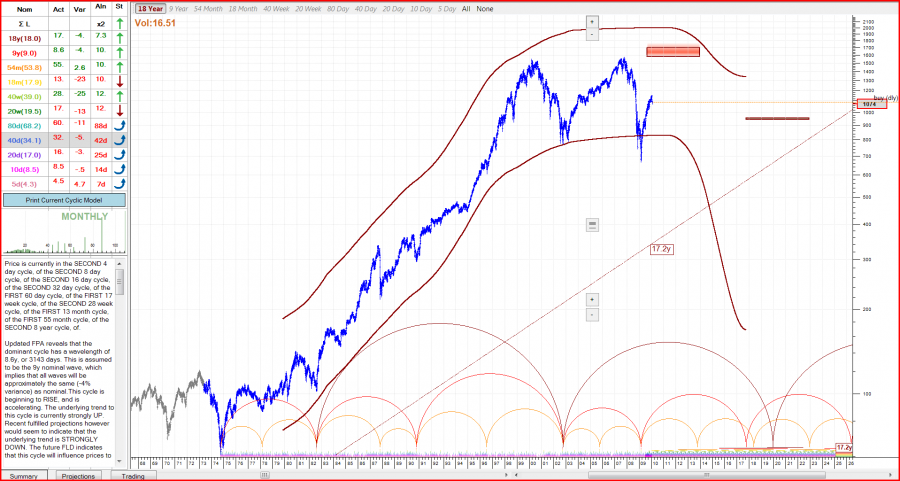
The second chart is S&P500 and while the 2013 period is obvious, the emphasis is on 2017 (and maybe 2020). THe US alternating bear/bull markets are about 17 years (or Armstrongs 2X8.6 years) from 2000.
Makes me even more confident as my analysis was done without seeing this analysis.

Member

Posted 31 January 2010 - 01:03 PM
bad guy
Posted 31 January 2010 - 01:11 PM
Member

Posted 31 January 2010 - 02:19 PM
most of the cycles point up?


