Crafting the rhythms series III, 02/05/2012
Year of the Water Dragon
An excellent photography
Tale of the Dragon
creditor: Photos of Creation - John Fan Photography,
http://johnfanphotography.com/
By Fibo-Nacy
Reviews
(old post in italic font)
(i) Dec 9 2011, 11:09 AM
link
range bound [1277.55-1256.79-1215.42] [bullish-neutral-bearish]
On 01/05, index closed at 1283.05. Since then, index headed higher. In retrospect, one might think this call is too conservative. In the Crafting the rhythms series III, you can find many these kind simple gauges had worked effectively. I will initiate a new set that aims on the middle to long term in a later section.

(ii) Jan 17 2012, 10:37 AM
link
Retaking 1294, a profound development:
SPX index regained the 1293.61 pivot with good margin ( 1303.00 vs. 1293.61 ), as a technician, I shall abide what I have seen & interpret the chart without bias.
Without violating the critical support, a High has yet to be seen. In other words, the uptrend since March/09 is still intact.
(iii) Nov 25 2011, 11:38 AM
link
King Wens sequence:
[low: 12/20, 01/04, 01/18, 01/31, 02/13 ....] (12/19)
[high 01/17, 01/30, 02/10......]
Low: root date 10/04, 1074.77
High: root date 10/27, 1292.66
The Low observed on 12/19 has been confirmed. This secondary low happened one trading day earlier than what King Wens sequence had projected. Now lets focus on whether a secondary high will take place in between 01/30 and 02/10. I use the wording secondary because the King Wens sequence is an immediate term time speculator.
In terms of cycle, Eric Hadik covered much more technical information in his The INSIIDE Track - 01/31/12.
Here is a short quote:
"Stock Indices reinforced the uncanny reliability of the 11-Week Cycle as they surged from their projected December 19--23rd lows... .... The Dec. 19th low created an 11-week high-high-high-low-low ...... .... ... all aligning on March 5--9, 2012, the 3-year anniversary of the March 6/9, 2009 major low. The Dec. 19th low was also the midpoint of the most consistent cycle throughout the past 5 years ....... ....... ...it comes back into play in early-February).
read more
(iv) Oct 28 2011, 10:01 AM
link
So far, the 108 trading day cycle has recurred 4 times, the next one is due on 03/12/12 +/-. This particular cycle recurs and dampens out 'quietly', hardly get a handle on it.
updated chart (02/04/2012)

Depends on whether the begin/end date shall be counted, the 108 trading day cycle counting from 10/04/11 is due on 03/09/12 (Friday) or 03/12/12 (Monday), +/-. Keep a note that there is no sure thing it will recur again.
Lets check what a new King Wens sequence will say. By counting the low date from 12/19, the earliest low date for a new King Wens sequence will fall on 03/08/12 (54 trading days), and then, 03/21/12 (63 trading days); So, put these cycle time information all together, including the aforementioned time window ( all aligning on March 5--9, 2012 ), Will we see an Apex or Trough in the time window 03/05-03/12? Secondary or Primary? I think the trails is still fuzzy but the misty forest will get clear up very soon. In an anecdotal writing style, I sense there is strong conflict. How about this way, once it transpires I will let you know why. the hint is already embedded in this section.
Let me do another short quote :
MMA Comments for the Week Beginning February 6, 2012
Written by Raymond Merriman
The Asset Inflation Express is back on track. But not far ahead is yet another treacherous curve. Jupiter is fast approaching 7° of Taurus, the end of the cosmic line when equity prices historically complete long-term cycle crests.
read more
Outlook:
In the paper Peter Goodburn wrote, he mentioned Elliott's inclusion of the Contracting Diagonal, then he brought the new concepts:
The Expanding-Diagonal, a mirror image of the Contracting type pattern and Triangle terminology - counter-trend vs. trend impulse patterns. furthermore, he wrote During the many years of teaching the Wave Principle, I have found students often confused by this because both are distinctly different types of pattern, yet both incorporate the term "triangle". To make it easier, I have dropped the association "triangle" when referring to the diagonal so that a diagonal is either a generic leading-contracting/expanding diagonal or an ending-contracting/expanding diagonal, leaving out the term triangle altogether.
Author Terms
EXPANDING DIAGONAL PATTERNS
By Peter Goodburn
Charts compiled & edited by Kamil Rajec
http://www.wavetrack...l-patterns.html
WaveTrack International (WTI) -
http://www.wavetrack...ernational.html
WaveTrack International GmbH
http://www.wavetrack.com/
All rights are copyright to WaveTrack. Reproduction and/or dissemination without WaveTrack's prior consent is strictly forbidden. We encourage reviews, quotation and reference but request that full credit is given.
{ I skip a long section I wrote earlier. Anyway, these
gobbledygook wave infrastructure is not very effective way for a pictorial outlook. I may post it
when grapes are ripen }
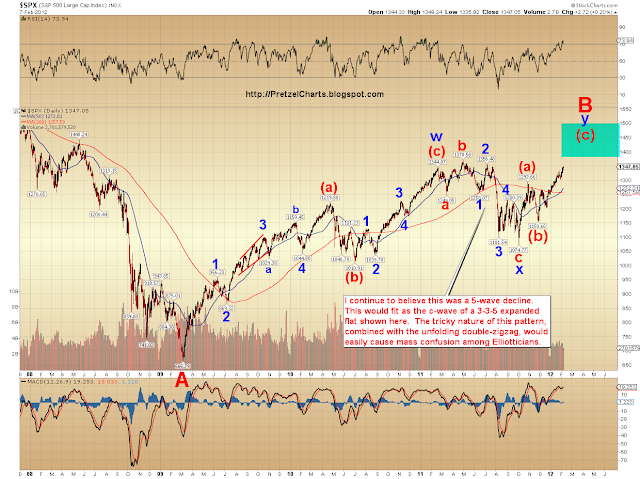
The following chart is the essence of this post.
The critical resistance is 1332-1342, one level up to see 1376-1440. second critical resistance is 1440-1450 to see the new high, >1576. The critical support is 1133, one level down to see 966, very close to Stanleys long term target he posted in Apr 2011 (950, 940-972)
1132.67 = [0.786:(1345.341074.77]
966.03 = [0.559:(1345.34-0666.79]


