

Wall Street Sentiment Daily for 5/03/10
Institutional Sentiment and Analysis
Monday 5/03/2010 at 8:35 am
By Mark Steward Young
The NEW tthq.com Wall Street Sentiment message board password is *******.
Short-Term Sentiment: Bullish.
Overall Intermediate-Term Sentiment: Mildly Bearish for the market.
Individual Investor Sentiment: Bearish for the market.
Small Speculator Sentiment: Bullish for the market.
Small Hedge Fund/Manager Sentiment: Mixed for the Market.
Longer-term Trend:
Bull Market Condition.
Intermediate-term Trend:
Negative. Confirmed.
Short-term (one-day) Signal:
None. Looking Long.
We are trading these signals and others intra-day for our Premium subscribers--contact us for details ( http://www.wallstreetsentiment.com/contact.html).
Ideal ETF Portfolio (tracking portfolio):
25% QLD at 34.30
50% QID at 33.21
25% QLD at 26.09
We've adjusted the hedge (re-balanced) as of 10/22/09. We may rebalance the hedge.
*******************************************************
We're pretty oversold and the options, message board polls, and Senticator say, "Bounce time". Otherwise, however, there is still too much optimism.
*******************************************************
Message Board Sentiment
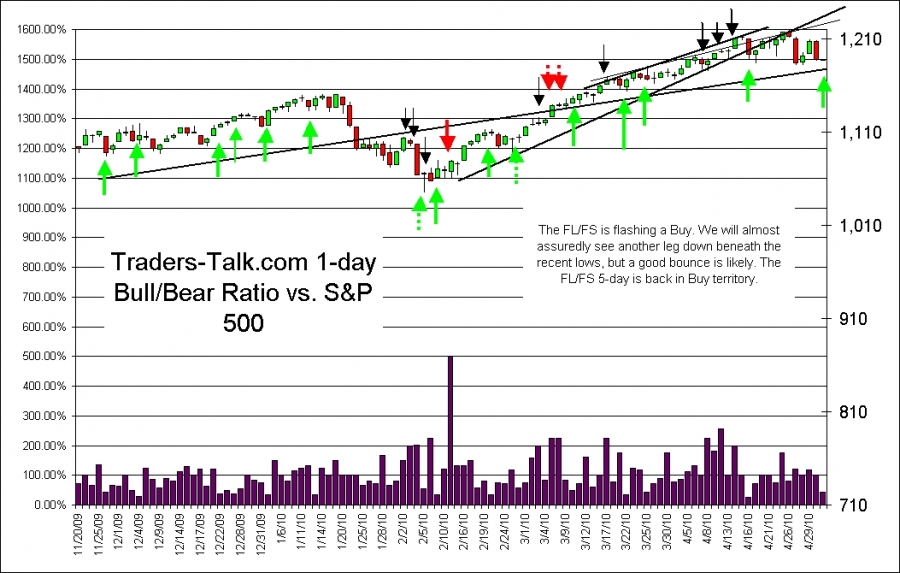
The message board sentiment poll now shows Bulls at 17% and Bears at 58%. This would be Bearish since these guys tend to be right, at least near-term for a bit, but over 50% is a fade and this is very high. Participation was good. The Actual Position Poll now shows 14% fully long and 8% partially long. 22% are partially short and 36% are fully short. This is way above my 20% threshold and is Bullish for the market. There are very few long Bulls, too. We have a FL/FS Buy and while we may have more weakness coming, a bounce is likely. The 5-day Fully Long/Fully Short (FL/FS) ratio is back in "buy territory".
Check out www.traders-talk.com for early updates of the sentiment polls every day and overnight.
Our T-4 Turn Indicator went out at 54, which is away from a signal. The last signal was a Sell. Typically we want to see readings above 70 or higher (now that we've made changes to the posting guidelines). This indicator doesn't catch every top and bottom, but it is a great "Heads up!" indicator.
Following is a recap of the Weekend Letter:
Proprietary Surveys
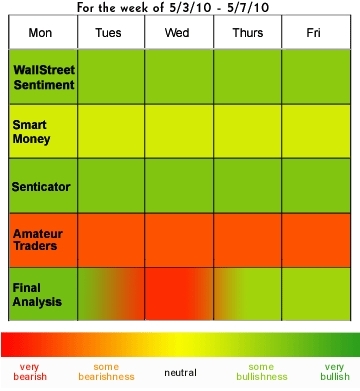
This week, the WSS Surveyees are rather Bearish. The "Smart Money" guys are only a little Bearish. The "Amateurs" have a goodly number of Bulls again. Not good. The Senticator is flashing a Buy. This is not inconsistent with a bounce, but I think we can expect some more selling.
Options Sentiment
Daily P/C ratio: 1.06. Buy.
10-day P/C ratio: 0.84. Neutral.
Equity P/C ratio: 0.61. Negative.
OEX PC ratio (not a fade): 1.83. Sell.
OEX 10-day PC ratio: 1.38. Neutral.
OEX $-weighted* P/C ratio: 5.33. Buy.
NDX $-weighted* P/C ratio: 1.39. Neutral.
QID (Ultra Short QQQQ) P/C ratio: 0.13. Constructive.
SDS (Ultra Short SPX) P/C ratio: 0.17. Constructive.
ISEE Sentiment Index: 95. Buy.
10-Day ISEE Sentiment Index: 130. This is no longer in sell territory but the prior Sell may still be in affect. (H/T to persistent subscriber)
Relative VIX: Neutral.
Daily VIX: Buy.
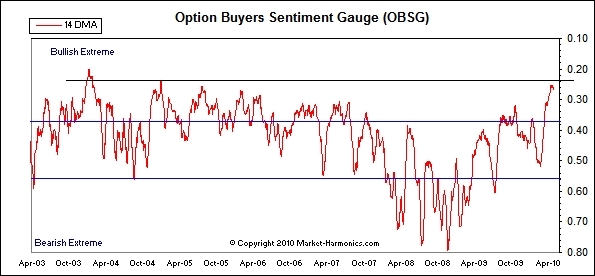
The P/C's are somewhat Bullish, though I'd expect to see more uniform Bearishness. Still, the options suggest a bounce at least. Market Harmonics' Options Buyers Sentiment Gauge (thank you, Tony Carrion http://www.market-harmonics.com) is still in Sell territory.
Most options indicators are contrary; if folks are buying calls, we want to fade them and go short. The OEX nominal P/C is an exception, because the OEX traders tend to be right, unless they are paying up for options (which will show up in the $-weighted data).
The ISEE Sentiment Index indicator is contrarian; traditionally, over 200 is too optimistic, under 100 is too pessimistic. *$-weighted P/C data courtesy of Fari Hamzei of www.hamzeianalytics.com . Readings over 2.0 are Bullish and near 0.5 are Bearish. OBSG provided by Tony Carrion of Market Harmonics.
General Public Polls
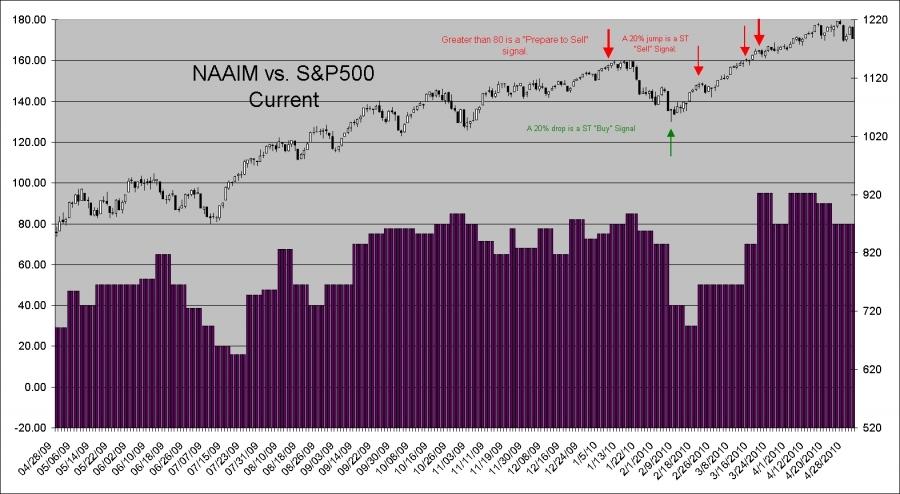
National Association of Active Investment Managers (NAAIM) Sentiment Survey reported that the median market exposure remained at 80%, which is still just in intermediate-term "Sell" territory. This is not a "Sell Signal". This indicates that caution is indicated (this crew often gets right during strong trends). The aspect that causes me some concern is that two weeks ago, the most negative exposure was 100% short and now the most negative exposure is flat. That implies capitulation on the part of the die hard Bears. This has, in the past, marked tradable tops. For more on our analysis, see this brief study http://www.traders-talk.com/mb2/index.php?showtopic=115139.
TSPTalk reported 64% Bulls and 25% Bears. That's a Sell by their new measures, and I have to view that as a Sell too. That's a lot of Bulls. I note that the last signal was pretty timely, even though their model got a bad execution. They are now using their Bull Market Filter and it has been doing pretty darned well for them.
Last week, AAII reported 41.26% Bulls and 28.64% Bears. That's a jump in Bullishness and good drop in Bearishness. This isn't a Sell, but it's short-term modestly Bearish. We're still well away from any kind of signal. Last week, we had 38.12% Bulls and 34.25% Bears.
Investors Intelligence reported 54% Bulls and 18% Bears vs. 53.30% Bulls and 17.4% Bears last week. Another little jump in Bulls and a little jump in Bears. Still, well into Sell territory. This data is very cautionary but not an outright signal. Advisors tend to get right in solid trends.
The Newsletter Advisors got more Bullish on Friday and are now 65.5% net long from 59.3% last week. This is both very high and a rise in a deteriorating market. BAD news. Naz advisors got even more Bulled-up at a 72.9% (vs. 65.7%) long reading. This as high as I can remember it and is a real reason for concern.
Lazlo Birinyi's site, Tickersense, reported 52.94% Bulls and 17.65% Bears vs. 33% Bulls and 40% Bears last week. That's a big jump in Bulls and very bad news for the market.
RealMoney Poll is not available currently.
Conclusion
Last week, I said that I smelled a rat on Monday because there were too many on board for the "Free Money Monday" trade. I thought that strength on Monday would not hold. We pretty much nailed that one. We also predicted a resilient bounce after some early weakness, which we got. Friday's action was off our radar as of last Sunday, but it was pretty clear that we had trouble coming when we saw the sentiment on Thursday night. Looking at the charts and the technicals, it sure looks like there's more weakness coming. On the other hand, we're overdone and need to bounce. The Senticator says look for a bounce and better yet, we have a FL/FS Buy signal. We ought to look for a bounce at any time, but I would not look for the advance to resume until we have taken out ES 117000, at least. We probably need to get some Bearishness built back up and this may take not just a two leg correction, but a series of a-b-c's. The weekly trend has turned down and the seasonal is negative too. My call for the week us for a rally on Monday, into Tuesday, then down into Wednesday, and up Thursday and Friday.
We've changed the chart below for clarity. The color in the chart indicates the Bullishness or Bearishness for the market. This eliminates the need for interpretation. If the Smart Money or the Amateurs are green, then you can conclude that such is is Bullish for the market.
We are on twitter and we offer comments and trade updates throughout the day as we have time or as we see sentiment of interest. You can follow us at http://twitter.com/WallStSentiment .
The Mechanical Senticator Model and the Subjective Model will go 1/2 long at the open, unless we are upmore than 5 SPX points. We may add on strength. Remember, these models must trade in the direction of the Senticator or not at all. In case you haven't been keeping track, we just figured that the Senticator has outperformed the market by 58% over the past 3 3/4 years and is up nicely (15%) this year--that's with no leverage and few shorts.
We are looking both ways again after nailing a nice long and missing a nicer short yesterday. Since we've been publishing our ST Sentiment Signals, we've had 154 trades and 102 winners. If you'd like a trial, feel free to contact us http://www.wallstree...om/contact.html.
****************
Ideal ETF Portfolio (tracking portfolio):
25% QLD at 34.30
50% QID at 33.21
25% QLD at 26.09
We have adjusted the hedge as of 8/27. We may re-balance.
*******************************************************
Past performance is no guarantee of future returns. All information included in this missive is derived from sources we believe to be reliable, but no guarantee can be made to that effect. None of the forgoing should be construed as an offer or solicitation to buy or sell any security. The publisher may have a long or short position in the funds or securities discussed at any given time. We aren't your advisor, unless you have a signed contract with us. Please review any trade that you do with your trusted advisor FIRST.
---------------------------------------------------------------------------------
Note that we are publishing on our private area on Traders-talk.com, providing on-line access to our charts and research. The password is at the top of this letter. http://www.traders-t...hp?showforum=47
(you'll need to register and sign in on Traders-talk and you'll need an additional password to access the board. If you are a subscriber and you do not have a password, please contact us).
For more on using Wall Street Sentiment and the various sentiment data included, click here:
http://www.WallStreetSentiment.com
Mark Young
Editor
859-393-3335
818-MARKETS


