
InterDigital, Inc.(NASDAQ:IDCC) looks to be a possible breakout play
Started by
Costa
, Nov 29 2012 01:37 AM
1 reply to this topic
#1
 looks to be a possible breakout play: post #1")
Costa
-
- Traders-Talk User
- 660 posts
Member
Posted 29 November 2012 - 01:37 AM
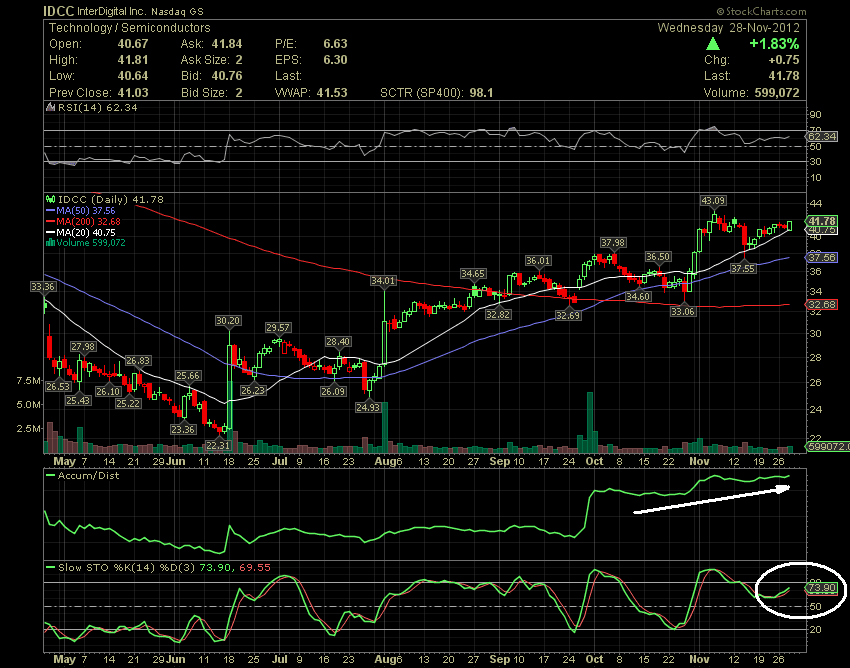
I'm going to keep an eye again on InterDigital, Inc.(NASDAQ:IDCC) and see how it reacts tomorrow after today's gains. Technical chart shows a nice bullish stochastic cross combined with a nice bounce off the 20-day MA. In addition, the accumulation chart looking great. The next resistance level to watch is at 42. Above this level could test 43.08 next.
Costa
AC Investor Blog Keep up to date by subscribing AC Investor Blog newsletter or RSS feed. You may wish to also follow me on Twitter.
AC Investor Blog Keep up to date by subscribing AC Investor Blog newsletter or RSS feed. You may wish to also follow me on Twitter.
#2
Costa
-
- Traders-Talk User
- 660 posts
Member
Posted 01 December 2012 - 04:01 AM
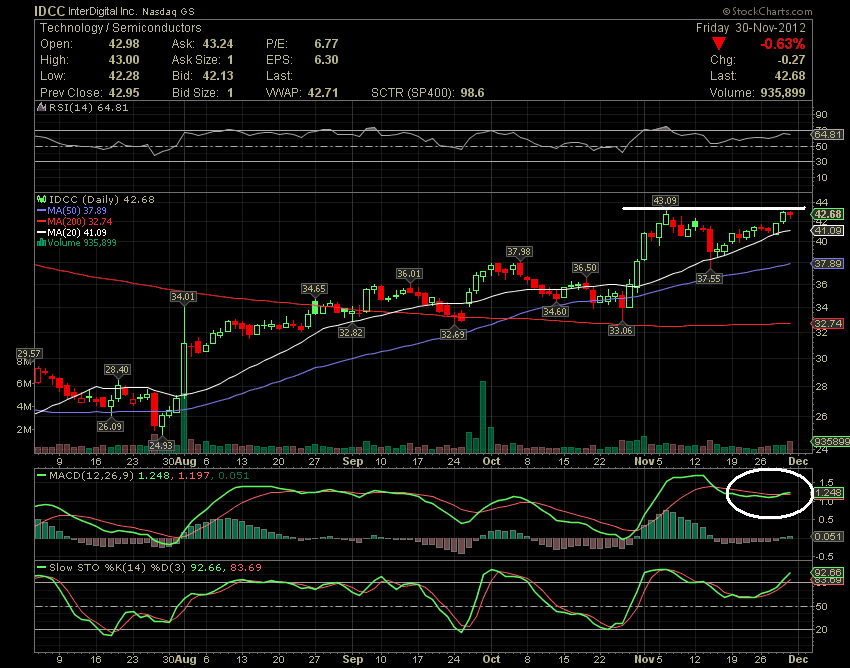
I've been bringing InterDigital, Inc.(NASDAQ:IDCC) to my readers the last few months and the stock is again on the verge of a possible breakout. For the coming week, watchout for a possible breakout over $43.09 which is the previous high. Based on a technical perspective the stock shows very strong bullish sign. First of all, the stock is trading above 20/50-day and 200-day moving average with all major moving averages pointing upwards. Then the daily MACD indicator is back above signal line also indicating a buy. In addition, KD line still show the stock is on the positive swing. The short interest remains high at over 13 percent and shorts will need more than 9 days to cover. So, if it breaks above the 43.09 level then a squeeze definitely will happen. I'll be watching the stock again on Monday for a possible Breakout.
Costa
AC Investor Blog Keep up to date by subscribing AC Investor Blog newsletter or RSS feed. You may wish to also follow me on Twitter.
AC Investor Blog Keep up to date by subscribing AC Investor Blog newsletter or RSS feed. You may wish to also follow me on Twitter.


