
The Trend
Started by
Chart Guru Doug
, Jan 29 2005 11:03 PM
30 replies to this topic
#1

Chart Guru Doug
-
- Traders-Talk User
- 2,789 posts
Member
Posted 29 January 2005 - 11:03 PM
I would like hear how traders here decide which way the trend is going. Can you give us your simple description?
Thanks a bunch!
I am not your registered investment advisor. This is not a recomendation to buy or sell. This is my opinion and that is all. I may be long or short any security and change my position at any given moment in time. Do your own due diligence before investing any of your own financial assets.
#2
selecto
-

- Traders-Talk User
- 6,871 posts
Member
Posted 29 January 2005 - 11:08 PM
BB centerline (20 sma) with an 18 ema warning and a 7sma signal - in all windows.
"Mojo" also derived from various ma's & technicals of sentiment stuff.
(That's trend, not necessarily trading triggers.)
#3
SemiBizz
-

- Traders-Talk User
- 23,208 posts
Volume Dynamics Specialist
Posted 29 January 2005 - 11:16 PM
This is easy, I apply Wyckoff's techniques, I look at volumes at swing points in the market. Looking at the Nasdaq composite, the two biggest days of volume in this timeframe were 12/7/04 and 1/3/05
Here's the datapoints:
................. High...... Low ...... Volume
12/7..... 2161.30...... 2114.65 ..... 2.59B
1/3 ..... 2159.64..... 2100.56..... 2.69B
First of all, we go to a lower low on higher volume, that's the first part. Secondly, even with higher volume we were unable to penetrate the high on 12/7.
Conclusion: Weakness, Downtrend.
Volume/price interaction says it all in my World.
What I'd be looking for in a trend reversal here would be a trading day over the 2.69B shares and a swing high over the 2161.30... Although I have my hunches about the market trend and where it goes, the volume/price interaction is what I use to guide my trading....
Edited by SemiBizz, 29 January 2005 - 11:20 PM.
Price and Volume Forensics Specialist
Richard Wyckoff - "Whenever you find hope or fear warping judgment, close out your position"
Volume is the only vote that matters... the ultimate sentiment poll.
http://twitter.com/VolumeDynamics http://parler.com/Volumedynamics
Richard Wyckoff - "Whenever you find hope or fear warping judgment, close out your position"
Volume is the only vote that matters... the ultimate sentiment poll.
http://twitter.com/VolumeDynamics http://parler.com/Volumedynamics
#4
Sentient Being
-

- Traders-Talk User
- 4,262 posts
Member
Posted 29 January 2005 - 11:25 PM
I tend to take my computer generted buys then:
1. I draw a line across the tops and the bottoms in the time frame I'm looking at.
2. Or I'll drop in a channel tool and let it draw the lines as I establish the time frame.
3. And if all else fails, look at my position, if I'm long the trend is down and if I'm short the trend is up. I'm really good at getting it wrong. 
In the end we retain from our studies only that which we practically apply.
~ Johann Wolfgang Von Goethe ~
~ Johann Wolfgang Von Goethe ~
#5
atlasshrugged
-

- TT Patron+
- 4,409 posts
Member
Posted 29 January 2005 - 11:34 PM
two ways
Daily chart with 20, 50,200 ema
Weekly chart with 8 20 50 ema
The weekly carries more weight
#6
SemiBizz
-
- Traders-Talk User
- 23,208 posts
Volume Dynamics Specialist
Posted 29 January 2005 - 11:39 PM
TREND TRADING STRATEGY:
Using Wyckoff, when the Nasdaq hit the 2159, 1/3, on what appeared to be a blowout volume day, that set up a LOW RISK ENTRY. I shorted NVDA at 24 that morning, NTGR at 19. This was easy, because if the Nasdaq subsequently had gone over the 2161, that would be my stop... That's the beauty of Wyckoff, Risk/Reward.
Price and Volume Forensics Specialist
Richard Wyckoff - "Whenever you find hope or fear warping judgment, close out your position"
Volume is the only vote that matters... the ultimate sentiment poll.
http://twitter.com/VolumeDynamics http://parler.com/Volumedynamics
Richard Wyckoff - "Whenever you find hope or fear warping judgment, close out your position"
Volume is the only vote that matters... the ultimate sentiment poll.
http://twitter.com/VolumeDynamics http://parler.com/Volumedynamics
#7
Rogerdodger
-

- TT Member*
-

- 26,872 posts
Member
Posted 30 January 2005 - 01:16 AM
Which trend? 5 min, hourly, daily, weekly?
"Nature's Failure to Function in a 'Predictable Way'... 500 years ago?"
BIGGEST SCIENCE SCANDAL EVER...Official records systematically 'adjusted'.
BIGGEST SCIENCE SCANDAL EVER...Official records systematically 'adjusted'.
#8
SemiBizz
-
- Traders-Talk User
- 23,208 posts
Volume Dynamics Specialist
Posted 30 January 2005 - 01:17 AM
Price and Volume Forensics Specialist
Richard Wyckoff - "Whenever you find hope or fear warping judgment, close out your position"
Volume is the only vote that matters... the ultimate sentiment poll.
http://twitter.com/VolumeDynamics http://parler.com/Volumedynamics
Richard Wyckoff - "Whenever you find hope or fear warping judgment, close out your position"
Volume is the only vote that matters... the ultimate sentiment poll.
http://twitter.com/VolumeDynamics http://parler.com/Volumedynamics
#9
Chart Guru Doug
-
- Traders-Talk User
- 2,789 posts
Member
Posted 30 January 2005 - 04:44 AM
If you use different methods for different timframes, feel free to post them.Which trend? 5 min, hourly, daily, weekly?
Good thread going guys, keep it up!
I am not your registered investment advisor. This is not a recomendation to buy or sell. This is my opinion and that is all. I may be long or short any security and change my position at any given moment in time. Do your own due diligence before investing any of your own financial assets.
#10
Stickan
-

- Traders-Talk User
- 411 posts
Member
Posted 30 January 2005 - 07:02 AM
I find that regression channels with 2% deviation is great at catching trends on all levles. Experimenting with other % settings can also give good results (like fib 1.618 etc). Different markets has different % alsodifferent dimeframes can vary in the same market.
Combining regr.channels with Median Lines can sometimes support findings. Like in this chart
The regressin channels are with 2% deviation (blue down and red up) and the green Pitchfork is parallell with th]e channels, which supports the opinion that the main tend is up (unless you drop below the grey line at D).
I use tops and bottoms for the regression channels. Thus if you suspect we have a bottom at hand, use the previous top together with the supected bottom. If ithe channel fits and you the have a clear break of the upper channel line a tredn break is probably what happend.

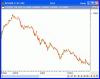
In this chart below I have used data from what some say is the start of this bullmarket 1982 up until today. Std deviation is set to 3% upper and 2% lower.
stig

Combining regr.channels with Median Lines can sometimes support findings. Like in this chart
The regressin channels are with 2% deviation (blue down and red up) and the green Pitchfork is parallell with th]e channels, which supports the opinion that the main tend is up (unless you drop below the grey line at D).
I use tops and bottoms for the regression channels. Thus if you suspect we have a bottom at hand, use the previous top together with the supected bottom. If ithe channel fits and you the have a clear break of the upper channel line a tredn break is probably what happend.
In this chart below I have used data from what some say is the start of this bullmarket 1982 up until today. Std deviation is set to 3% upper and 2% lower.
stig


