http://bigcharts.mar...&mocktick=1.png

SPX Hourly chart
Started by
Russ
, Jan 08 2009 09:39 PM
10 replies to this topic
#1

Russ
-
- Traders-Talk User
- 7,375 posts
Member
Posted 08 January 2009 - 09:39 PM
"Nulla tenaci invia est via" - Latin for "For the tenacious, no road is impossible".
"In order to master the markets, you must first master yourself" ... JP Morgan
"Most people lose money because they cannot admit they are wrong"... Martin Armstrong
http://marketvisions.blogspot.com/
"In order to master the markets, you must first master yourself" ... JP Morgan
"Most people lose money because they cannot admit they are wrong"... Martin Armstrong
http://marketvisions.blogspot.com/
#2
TheArchitect
-
- TT Member+
- 1,659 posts
Member
Posted 08 January 2009 - 10:07 PM
http://bigcharts.marketwatch.com/charts/big.chart?symb=spx&compidx=aaaaa:0&ma=0&maval=9&uf=0&lf=65536&lf2=2&lf3=0&type=4&size=3&state=8&sid=3377&style=320&time=18&freq=8&comp=NO_SYMBOL_CHOSEN&nosettings=1&rand=9025&mocktick=1.png
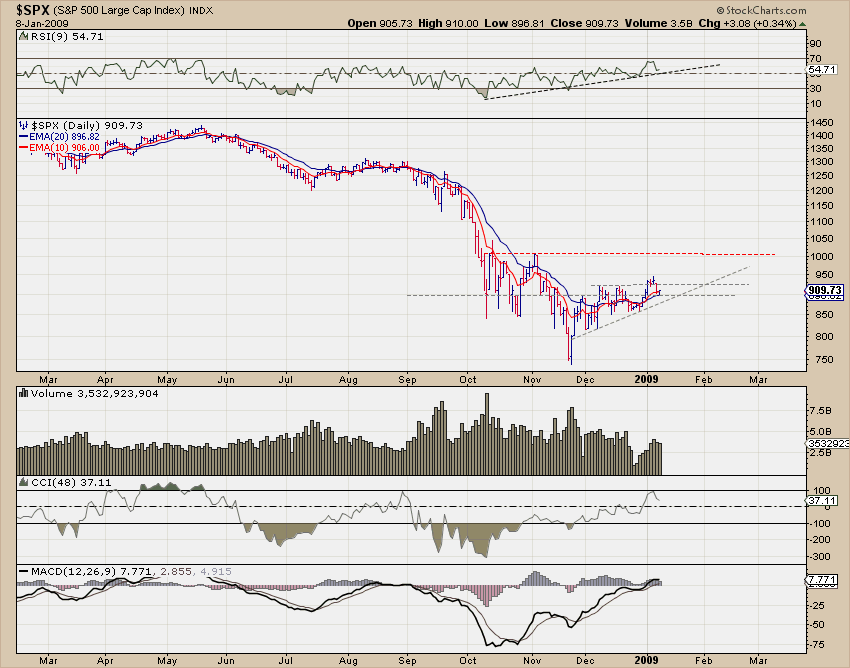
on the chart you posted... i see price being supported at $900... with momentum and price turning up... and if you scale out more than a week, it's all within the context of a clear uptrend... do you think $950 was a top? i think you'd expect some resistance at 950... as there was at 900... i dunno... i don't think 950 was the top.
#3
U.F.O.
-

- TT Patron+
- 5,605 posts
U.F.O.
Posted 08 January 2009 - 10:17 PM
Here's that uptrend TA mentions. (1 hourly chart)
U.F.O.

U.F.O.
"Democracy is two wolves and a lamb voting on what to have for lunch. Liberty is a well-armed lamb contesting the vote!"
~Benjamin Franklin~
~Benjamin Franklin~
#4
pokerden
-

- Traders-Talk User
- 27 posts
Member
Posted 08 January 2009 - 10:32 PM
doesn't it make a lovely bearish rising wedge on that 60 minute chart?

#5
tommyt
-

- Traders-Talk User
- 5,136 posts
Member
Posted 08 January 2009 - 10:56 PM
doesn't it make a lovely bearish rising wedge on that 60 minute chart?
not really, just some sort of uptrend.
#6
Data
-

- Validating
- 2,618 posts
Member
Posted 08 January 2009 - 11:10 PM
896 is the November 28 high. It bounced off the level twice today. If it breaks through that level, it would be the third failed breakout (fourth if you count the original spike).
#7
TheArchitect
-
- TT Member+
- 1,659 posts
Member
Posted 08 January 2009 - 11:21 PM
it is a rising wedge, no doubt... which classically, will resolve in the direction of the trend... but i'd expect to see some negative divergences, i.e. weakness in the trend... before that resolution occurs... i don't see that yet... i just see price trending up, albeit choppy... it is the best sustained strength the market's had in a good few months... any shorts we've taken, have in hindsight, been clearly counter trend to this rally... who knows though... maybe it turns down tomorrow... 

#8
pokerden
-
- Traders-Talk User
- 27 posts
Member
Posted 08 January 2009 - 11:37 PM
Rising wedges are classically bearish.
You even state they are a continuation pattern...then the market will continue in the down trend as that is what it was prior to entering the rising wedge.
http://stockcharts.c...g_wedge_reversa
You even state they are a continuation pattern...then the market will continue in the down trend as that is what it was prior to entering the rising wedge.
http://stockcharts.c...g_wedge_reversa
it is a rising wedge, no doubt... which classically, will resolve in the direction of the trend... but i'd expect to see some negative divergences, i.e. weakness in the trend... before that resolution occurs... i don't see that yet... i just see price trending up, albeit choppy... it is the best sustained strength the market's had in a good few months... any shorts we've taken, have in hindsight, been clearly counter trend to this rally... who knows though... maybe it turns down tomorrow...
#9
Russ
-
- Traders-Talk User
- 7,375 posts
Member
Posted 09 January 2009 - 12:06 AM
As I have shown before the major market index tried 3 times to get through 1000, this in not a bullish statement. The long cci has started to turn down again.
http://stockcharts.com/c-sc/sc?s=$XMI&p=D&yr=0&mn=6&dy=0&i=p46951697253&r=3017.png
http://stockcharts.com/c-sc/sc?s=$XMI&p=D&yr=0&mn=6&dy=0&i=p46951697253&r=3017.png
Edited by Russ, 09 January 2009 - 12:11 AM.
"Nulla tenaci invia est via" - Latin for "For the tenacious, no road is impossible".
"In order to master the markets, you must first master yourself" ... JP Morgan
"Most people lose money because they cannot admit they are wrong"... Martin Armstrong
http://marketvisions.blogspot.com/
"In order to master the markets, you must first master yourself" ... JP Morgan
"Most people lose money because they cannot admit they are wrong"... Martin Armstrong
http://marketvisions.blogspot.com/
#10
Russ
-
- Traders-Talk User
- 7,375 posts
Member
Posted 09 January 2009 - 12:18 AM
The major market index is what the blue chips are doing, the strongest part of the economy and the above chart shows those stocks are stalling out.
The Major Market Index is designed to measure the performance of the blue-chip sector of the market, based on 20 well-known, highly capitalized stocks representing a broad range of industries. It is calculated continually by summing the component prices and reducing this total by the current Index divisor. The Index divisor is adjusted periodically (due to stock replacements and corporate actions such as stock splits, spinoffs, mergers, etc.) to ensure Index continuity.
Index Components
Components list as of 07/23/01
The Major Market Index is composed of shares of the following issues:
American Express Co. (AXP) General Motors Corp. (GM)
AT&T Corporation (T) International Business Machines Corp. (IBM)
Chevron Corp. (CHV) International Paper Co. (IP)
The Coca-Cola Company (KO) Johnson & Johnson (JNJ)
The Disney (Walt) Co. (this) McDonalds Corporation (MCD)
Dow Chemical Co. (DOW) Merck & Company, Inc. (MRK)
Du Pont (E.I.) de Nemours & Co. (DD) 3M (MMM)
Eastman Kodak Co. (EK) Philip Morris Companies, Inc. (MO)
Exxon Corp. (XON) The Procter & Gamble Company (PG)
General Electric Co. (GE) Sears, Roebuck and Co. (S)
"Nulla tenaci invia est via" - Latin for "For the tenacious, no road is impossible".
"In order to master the markets, you must first master yourself" ... JP Morgan
"Most people lose money because they cannot admit they are wrong"... Martin Armstrong
http://marketvisions.blogspot.com/
"In order to master the markets, you must first master yourself" ... JP Morgan
"Most people lose money because they cannot admit they are wrong"... Martin Armstrong
http://marketvisions.blogspot.com/


