
Relentless Distribution in Face of Complacency
Started by
linrom1
, Feb 25 2009 01:00 PM
3 replies to this topic
#1

linrom1
-
- Traders-Talk User
- 5,009 posts
Member
Posted 25 February 2009 - 01:00 PM
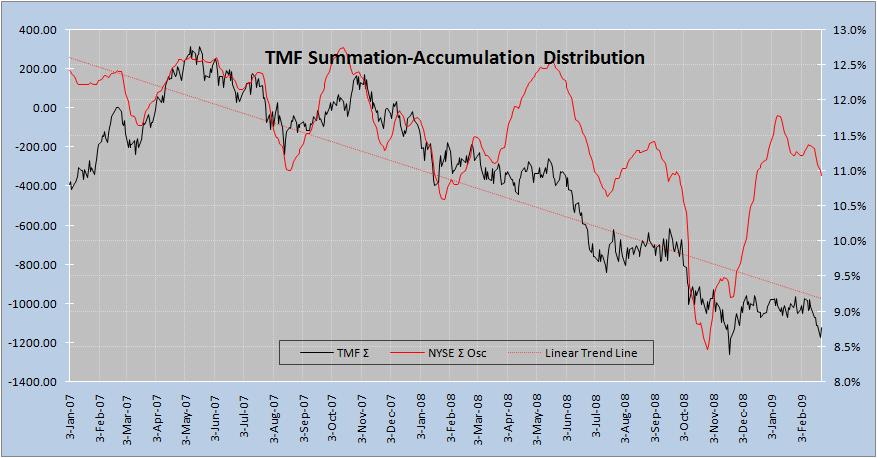
Sometime last year I had developed an Accumulation-Distribution indicator(TMF) based on ideas of Colin Twigs using ATR(average true range) concepts with many of my own twists. But I had overlooked it, and never paid much attention to it until now. It is amazing: it clearly shows the relentless distribution ongoing since May 2007--the true bull market top.
The TMT is a cumulative indicator that I charted against my other own indicator that shows cumulative price movements of NYSE Composite Index shown in red. Note that despite significant price oscillations(moves), TMT only once during late 2007 October market top brought about by FED Rate Cuts showed any accumulation at all. The rate of descent has not wavered and at best only moved sideways.
The market has been in full distribution mode since October 2007 top and my thoughts on volume(too high) confirm that view. There is nothing to be complacent about.
#2
SilentOne
-

- Traders-Talk User
- 3,452 posts
Member
Posted 25 February 2009 - 01:35 PM
linrom1,
Thanks for posting that chart. Can I ask how you are spotting accummulation on that chart. I assume it is when both trends are up. Would you agree that there was weak accummulation in the Spring of last year? Why I ask is that I am trying to pinpoint 9 and 18 month lows from a cycles point of view. If the 4.5 year low was in August 2007, then a great rally will unfold here once the next major low is confirmed. This would be an 18 month cycle low and the rally from that will be the best of this bear market (ie. eventual bottom then in 2011).
cheers,
john
Edited by SilentOne, 25 February 2009 - 01:38 PM.
"By the Law of Periodical Repetition, everything which has happened once must happen again and again and again-and not capriciously, but at regular periods, and each thing in its own period, not another's, and each obeying its own law ..." - Mark Twain
#3
linrom1
-
- Traders-Talk User
- 5,009 posts
Member
Posted 25 February 2009 - 03:31 PM
linrom1,
Thanks for posting that chart. Can I ask how you are spotting accummulation on that chart. I assume it is when both trends are up. Would you agree that there was weak accummulation in the Spring of last year? Why I ask is that I am trying to pinpoint 9 and 18 month lows from a cycles point of view. If the 4.5 year low was in August 2007, then a great rally will unfold here once the next major low is confirmed. This would be an 18 month cycle low and the rally from that will be the best of this bear market (ie. eventual bottom then in 2011).
cheers,
john
I don't see any evidence of accumulation in 2008 nor so far in 2009. The indicator is sensitive to volume moves versus intraday price. In order for accumulation to show up, TMF would have to begin to spike up with price moving somehow down or sideways. I don't have any intraday data for NYSE prior to 2003, so I can't chart it.
#4
SilentOne
-
- Traders-Talk User
- 3,452 posts
Member
Posted 25 February 2009 - 04:51 PM
linrom1,
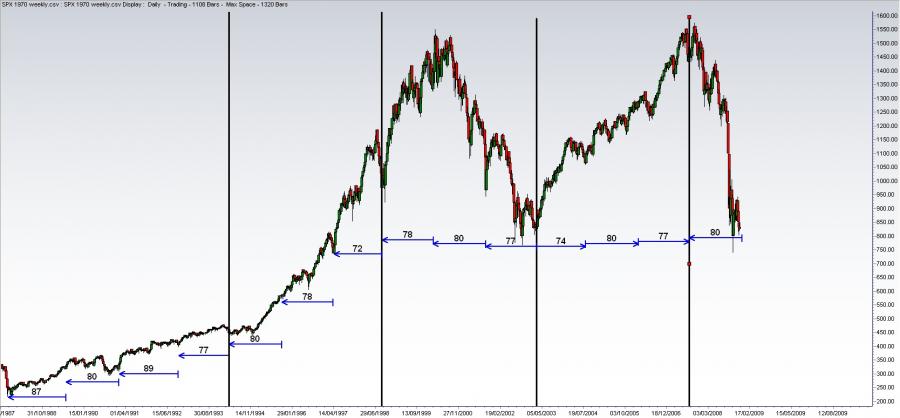
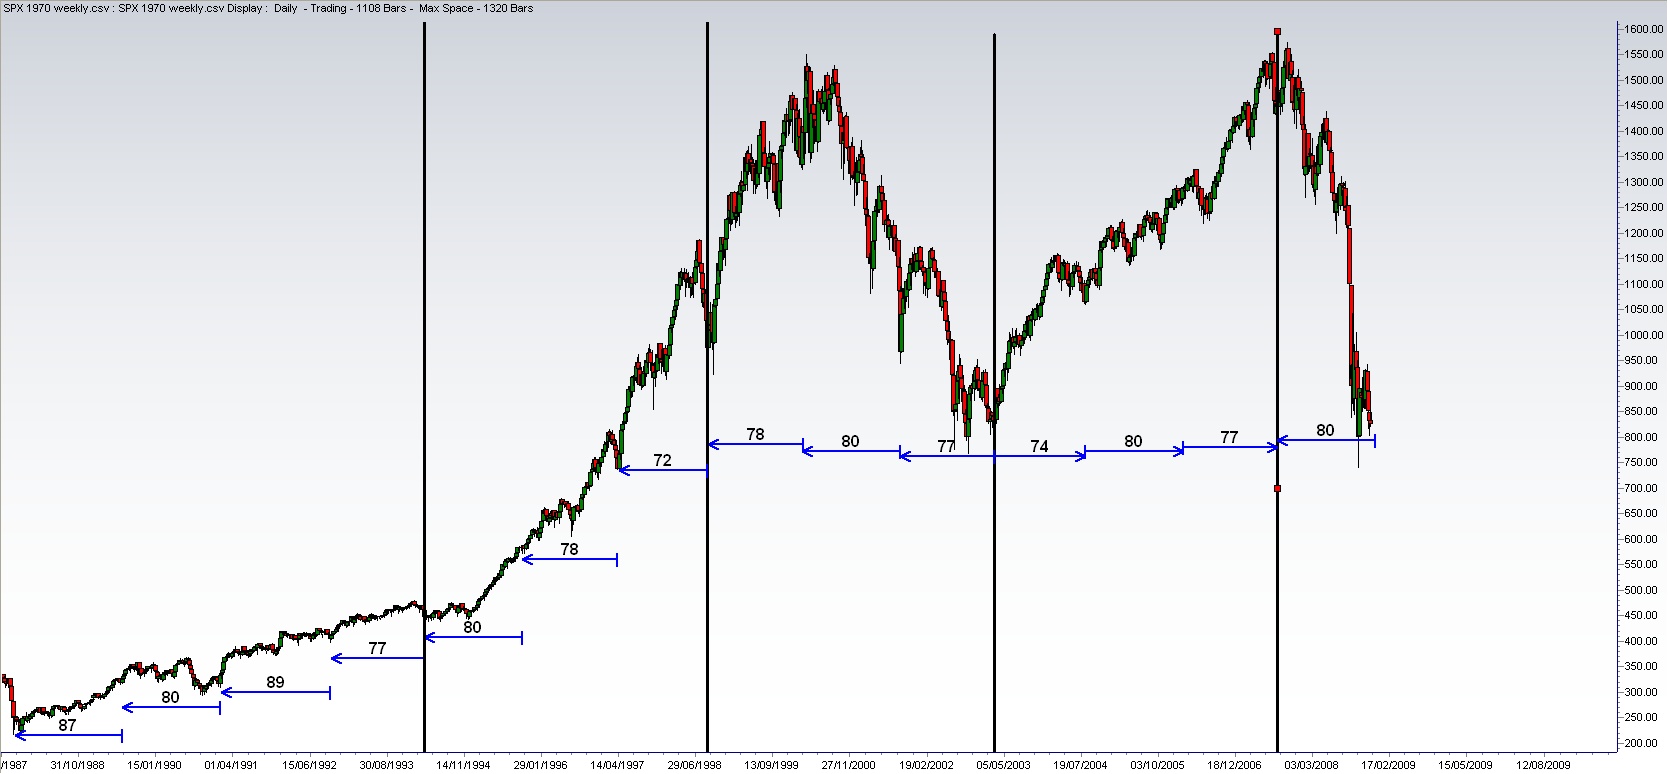
Thanks. I see what you are looking for now as signs of accummulation. The chart you show supports a 4.5 year Hurst cycle low at Aug. 2007 low. I just wanted to use this as more evidence to support the view. Here is why I am trying to do this. The black vertical lines are the 4.5 year cycle lows. If this phasing is correct, then an 18 month or 80 week cycle low is due soon off that low. We are in the 80th week off that low. 80 week lows are worth anticipating. That cycle can bottom at any time now, but likely by March 6th.
 cheers,
john
cheers,
john
 cheers,
john
cheers,
john
Edited by SilentOne, 25 February 2009 - 04:52 PM.
"By the Law of Periodical Repetition, everything which has happened once must happen again and again and again-and not capriciously, but at regular periods, and each thing in its own period, not another's, and each obeying its own law ..." - Mark Twain


