03/03/09
6:25EST
First things first:
The best indicator in the world for potential bottoms,
Is the media.
Last night and this morning, every major form of the media has the same headlines..
The Dow and its new 11 year low.
Traders we have a major bottom forming.
How it works is the media slowly ejects new Shorts into the market place,
whom were undecided whether or not to enter the short side at this current price level, although the media pushes these new shorts into the marketplace..
They cover on any significant burp upward creating the next upward movement.
We need three days to have major headlines in succession in order for this strategy to kick in. Its still early, but simply be aware of this powerful element.
Well yesterday morning we finally reached the Daily (ESH9) RCT down price.
Equalizer: 868.25
Up Price Target: 1021.50
Down Price Target: 714.75
If you remember back in December,
I took the RCT out from the back research room and placed it in the trading room.
RCTs are interesting and helpful patterns.
They tell us more than just where the price will go, they give us the trading swing range (which is 34.00 points) They have a larger magnetic field than the C/Ts.
They also tell us where the potential tops and bottoms will be.
The closest we ever came to the up price target was 942.75
RCTs are linear & Energy equality patterns.
Therefore we subtract the difference 942.75 1021.50 = 78.75
We then add this linear minus to the plus side (compression)
714.75 78.75 = 636.00
Therefore in no way shape or form shall we go below 636.00 on this down move.
639.00 is the first inner protective wall and the most powerful. If we reach this powerful magnetic wall on this current down move, the reaction will be atomic..
to the upside.
676.25 is the beginning of the second outer protective wall, (actually this wall is sub-divided into 4 sub sections) the last wall is at 671.25. If we reach it on this down move the reaction will also be quite powerful to the upside.
We still have 2 open patterns:
The GCT..(Genesis Compression Tunnel)
GCT is a compression cycle & Kaballa numbers pattern.
There is no magnetism
GCT (from 11/13/08)
Equalizer: 868.25
Up Target: 1029.50
Down Target: 695.25
Therefore the only pattern remaining with magnetism is the following C/T
Daily C/T (from 2/17/09)
Equalizer: 763.25
Up target: 833.25
Down Target: 693.00
Actually this C/T has up wave structure and number structure.
There exists a possibility we dont reach the down target price at 693.00
If we do we definitely extend one more revolution.
Due to the inner structure of the C/T
If we fail to reach the down price at 693.00
It means were back up..first to 763.25(doubtful)
Ill be updating soon,
Regarding short term (90 to 180 minutes) immediate direction

Master Che's update 3 Mar 2009
Started by
kavaron
, Mar 03 2009 06:36 AM
21 replies to this topic
#2

kavaron
-
- Traders-Talk User
- 289 posts
Member
Posted 03 March 2009 - 06:55 AM
03/03/09
6:45EST
I forgot something quite important
All technical research
E-wave counting..
Volume counting..
Gann
Fib.s
Trendlines
Should only be from 2/13/09, the open gap at 820.00
If not all of your figures will not be accurate
The above TA works well for short term mainly


#5
kavaron
-
- Traders-Talk User
- 289 posts
Member
Posted 03 March 2009 - 08:25 AM
03/03/09
8:15EST
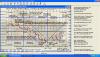
Regarding the chart
Notice the angle of decline on the 2 different Gap Fan T/Ls
The Top one has a stronger angle..more difficult to break above.
Ive corrected the chart guidelines
8:11EST
Next 52 minutes
Either 715.25 or 702.50
Depending on the equalizer..
Above up..
Below down
Regarding the 26 minute chart:
B/Ts are similar to pivots, but much more exact and powerful..
They share the qualities of resistance, support and immediate direction.
Gap Fan B/Ts function as support levels..


8:15EST
Regarding the chart
Notice the angle of decline on the 2 different Gap Fan T/Ls
The Top one has a stronger angle..more difficult to break above.
Ive corrected the chart guidelines
8:11EST
Next 52 minutes
Either 715.25 or 702.50
Depending on the equalizer..
Above up..
Below down
Regarding the 26 minute chart:
B/Ts are similar to pivots, but much more exact and powerful..
They share the qualities of resistance, support and immediate direction.
Gap Fan B/Ts function as support levels..


#6
Frankie
-

- Traders-Talk User
- 211 posts
Member
Posted 03 March 2009 - 08:30 AM
Thank you for all your work. Very nice.
#7
Funky Monk
-
- Traders-Talk User
- 406 posts
Member
Posted 03 March 2009 - 09:01 AM
fascinating stuff
thanks for posting
monk
#8
kavaron
-
- Traders-Talk User
- 289 posts
Member
Posted 03 March 2009 - 09:03 AM
If you wish to directly receive Updates
Please contact me as such at masterchetrading@hotmail.com
Master Che
#9
kavaron
-
- Traders-Talk User
- 289 posts
Member
Posted 03 March 2009 - 09:07 AM
03/03/09
9:00EST
Its still early but,
If we stay above the equalizer at 705.75
For the next 91 minutes
Were heading up to 749.75
Key Level: 711.00 711.50
In the event we fail to stay above the equalizer
Were heading down to 673.25
#10
mss
-

- TT Sponsor
- 6,182 posts
I'M WATCHING
Posted 03 March 2009 - 09:16 AM
 FWIW,
mss
FWIW,
mss
WOMEN & CATS WILL DO AS THEY PLEASE, AND MEN & DOGS SHOULD GET USED TO THE IDEA.
A DOG ALWAYS OFFERS UNCONDITIONAL LOVE. CATS HAVE TO THINK ABOUT IT!!
A DOG ALWAYS OFFERS UNCONDITIONAL LOVE. CATS HAVE TO THINK ABOUT IT!!


