I'm talking about gold stocks. They bottomed and rose before the market but aren't any where near the highs of this year.

Has anyone noticed
Started by
skott
, Jul 26 2009 05:56 PM
9 replies to this topic
#2

IYB
-

- TT Patron+
- 7,157 posts
Member
Posted 26 July 2009 - 06:07 PM
That's true of basically all commodities, and my "bell weather" issue, CME, which tends to lead commodities and equities:I'm talking about gold stocks. They bottomed and rose before the market but aren't any where near the highs of this year.
http://stockcharts.c...18934&r=588.png
Men, it has been well said, think in herds; it will be seen that they go mad in herds, while they only recover their senses slowly, one by one. ― Charles Mackay, Extraordinary Popular Delusions and the Madness of Crowds
#3
VolPivots
-

- Chartist
- 3,203 posts
Member
Posted 26 July 2009 - 06:17 PM
Interesting you mention that....I'm trying to work up some non-traditional "liquidity" indicators other than your standard breadth/volume type stuph. Gold stocks may be lagging a bit, but methinks Silver:Gold ratio is a better liquidity gauge. Another is what the Yen is doing....weaker yen and the Japanese central bank pumping liquidity into the system? Also watching the IEF:COY ratio. Finally, noticed a little bit ago the the TED spread is near its low since stockcharts started posting it...appears that"the world is awash in liquidity" once again...
#4
skott
-
- Traders-Talk User
- 4,712 posts
Member
Posted 26 July 2009 - 06:18 PM
could be giving us a clue. They may still be leading. time will tell
#5
skott
-
- Traders-Talk User
- 4,712 posts
Member
Posted 26 July 2009 - 07:53 PM
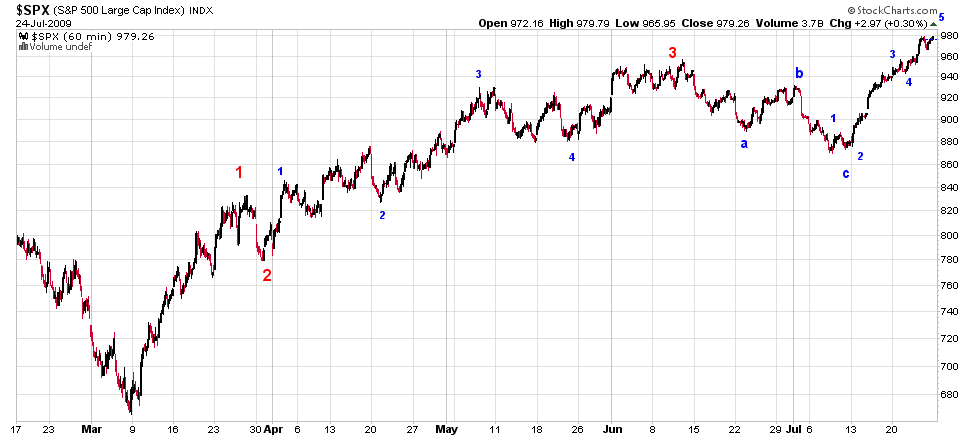
this is still the best count I have seen. for wave 5 to equal spx would have to go another 50 pts higher. could easily do it. At the same time you can count it complete and it can truncate. Just presenting some e wave. If this is correct I would still only expect a wave B pullback and then alot more upside.

#6
CLK
-

- Traders-Talk User
- 10,823 posts
Member
Posted 26 July 2009 - 08:17 PM
this is still the best count I have seen. for wave 5 to equal spx would have to go another 50 pts higher. could easily do it. At the same time you can count it complete and it can truncate. Just presenting some e wave. If this is correct I would still only expect a wave B pullback and then alot more upside.
I don't know, I think were still in wave 1 of this move.
#7
skott
-
- Traders-Talk User
- 4,712 posts
Member
Posted 26 July 2009 - 08:52 PM
you are right CLK, I forgot to mention that possibility. very possible
#8
skott
-
- Traders-Talk User
- 4,712 posts
Member
Posted 26 July 2009 - 08:53 PM
and I forgot to put the label for Wave 4. should be next to the Blue C
#9
raleigh
-

- Traders-Talk User
- 528 posts
Member
Posted 27 July 2009 - 12:05 AM
Counting angels on a pinhead is more accurate.
#10
skott
-
- Traders-Talk User
- 4,712 posts
Member
Posted 27 July 2009 - 12:47 AM
thank you for the respect we supposed to all show each other here raleigh


