Hi there Tor!!
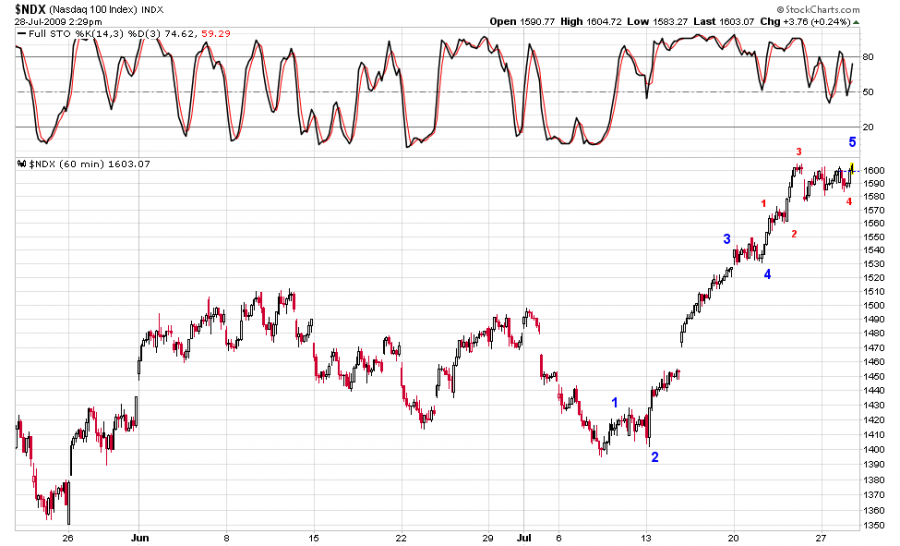
..just a possibility..
http://stockcharts.com/c-sc/sc?s=$NDX&p=15&yr=0&mn=0&dy=8&i=p07865566685&a=89413079&r=6685.png

Don't open this
Started by
eminimee
, Jul 28 2009 12:12 PM
8 replies to this topic
#1

eminimee
-
- TT Member
- 14,307 posts
I don't care who's fur is flying...
Posted 28 July 2009 - 12:12 PM
#2
thespookyone
-

- Traders-Talk User
- 6,043 posts
Member
Posted 28 July 2009 - 12:47 PM
Then, if you break out of the bottom there, would the asumption be that the 5 was already in? I saw what you point to here, and like the thought, but SPY looks a bit different.
#3
Cirrus
-

- TT Patron+
- 5,735 posts
Member
Posted 28 July 2009 - 12:57 PM
TA very useful...
EWave, well.....

#5
eminimee
-
- TT Member
- 14,307 posts
I don't care who's fur is flying...
Posted 28 July 2009 - 01:29 PM
yes..spy looks different.....totally aware of that....Then, if you break out of the bottom there, would the asumption be that the 5 was already in? I saw what you point to here, and like the thought, but SPY looks a bit different.
Keep in mind nonconfirmations (no predictive value at all according to some
 )....although I'm not at all confident that the highs are in on spx or oex...
ndx and nq just tagged there previous highs just now by the way..
#6
skott
-

- Traders-Talk User
- 4,712 posts
Member
Posted 28 July 2009 - 01:31 PM
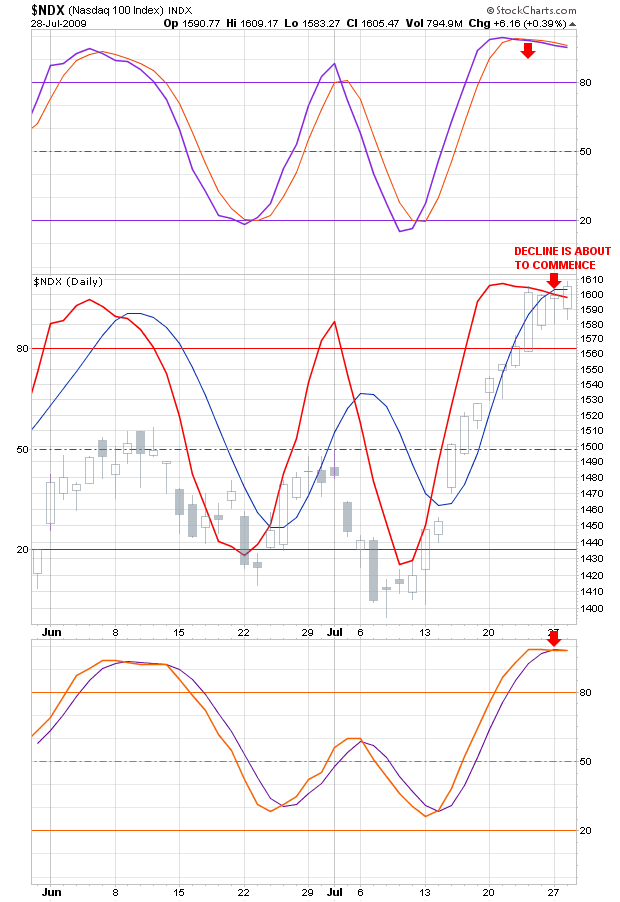
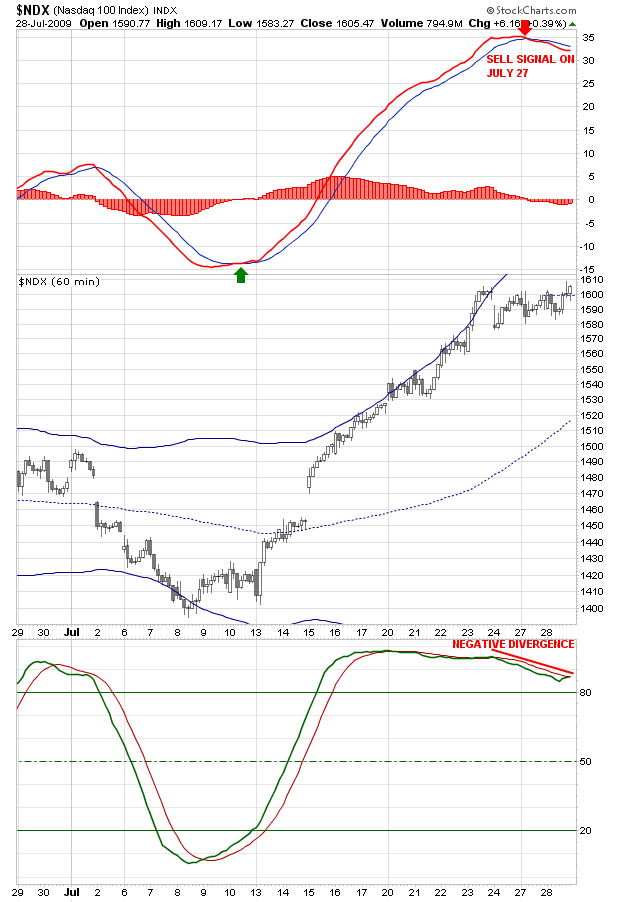
I can agree with that. Here is a broader view

#7
thespookyone
-
- Traders-Talk User
- 6,043 posts
Member
Posted 28 July 2009 - 01:35 PM
yes..spy looks different.....totally aware of that....Then, if you break out of the bottom there, would the asumption be that the 5 was already in? I saw what you point to here, and like the thought, but SPY looks a bit different.
Keep in mind nonconfirmations (no predictive value at all according to some
ndx and nq just tagged there previous highs just now by the way..
Saw that Tea, thx. My take is those highs aren't in, but are much closer than most think. Be it pattern, or wave, I get roughly the same target on NDX-a not "too lofty" one, LOL. I think SPY probably takes the ride here, and my target there fairly matches where the NDX would be at like time. I'm thinking the pattern completes into pre-GDP report, and a little "stranding happens Friday morning-TWT. Thanks for the chart, well done.
#8
rotrot
-

- Traders-Talk User
- 556 posts
Member
Posted 28 July 2009 - 07:55 PM
... a decline is close...


#9
MoneyFriend
-

- Traders-Talk User
- 917 posts
Member
Posted 28 July 2009 - 08:08 PM
This is my best guess for the next 6 months.

I think the rocket ride up likely will retrace/refuel, NDX seems spent to me here and SPX is acting too shy at this stage, relative to NDX - the fact that SPX has not already hit 1050 is a sign of IT weakness imo .
I think the rocket ride up likely will retrace/refuel, NDX seems spent to me here and SPX is acting too shy at this stage, relative to NDX - the fact that SPX has not already hit 1050 is a sign of IT weakness imo .


