http://stockcharts.c...amp;a=174050249
It could well be a C wave up or less likely the run to previous highs...
GS.

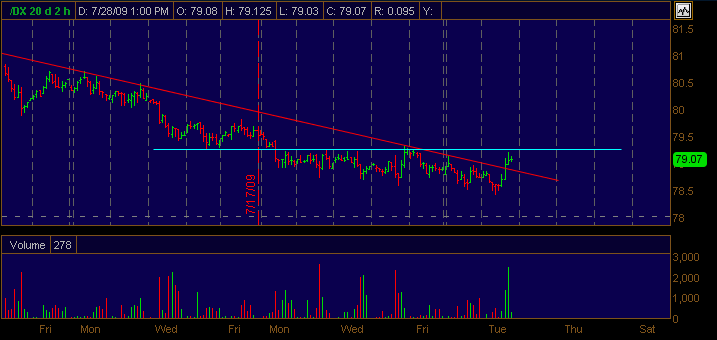
DX, This is what breakouts look like.
Started by
goldswinger
, Jul 28 2009 12:26 PM
8 replies to this topic
#2

eminimee
-

- TT Member
- 14,307 posts
I don't care who's fur is flying...
Posted 28 July 2009 - 12:51 PM
http://www.traders-t...?...=108534&hl=
couple of charts still worth following in that link..
UPP is useful...haven't seen anyone else use it until today...posted this last week...
http://stockcharts.c...1706&r=1771.png
couple of charts still worth following in that link..
UPP is useful...haven't seen anyone else use it until today...posted this last week...
http://stockcharts.c...1706&r=1771.png
Edited by Teaparty, 28 July 2009 - 12:52 PM.
#3
Slothrop
-

- TT Member
- 625 posts
Member
Posted 28 July 2009 - 12:54 PM
And the dollar going up is bearish for stocks since the Euro declines which indicates that risk appetite is falling off, etc.
#4
cappy
-

- Traders-Talk User
- 232 posts
Member
#5
goldswinger
-
- Traders-Talk User
- 2,612 posts
Member
Posted 28 July 2009 - 01:03 PM
Thanks Tea, you were right on the money when you posted those.... my post is more about showig confimation with the RSI breakout and the downtrend break to the upside. It must hold Today though.
So what 's your best guess: C wave up? or run to new highs? or maybe something else????????
GS.
#6
eminimee
-
- TT Member
- 14,307 posts
I don't care who's fur is flying...
Posted 28 July 2009 - 01:09 PM
Im long . http://stockcharts.c...notes,1029|1297
...and I'm very happy for you. Still a chance of another whipsaw but you should be fine...
#7
TheArchitect
-
- TT Member+
- 1,659 posts
Member
Posted 28 July 2009 - 01:21 PM
Im long . http://stockcharts.c...notes,1029|1297
...and I'm very happy for you. Still a chance of another whipsaw but you should be fine...
i don't know about calling it a breakout yet...
#8
goldswinger
-
- Traders-Talk User
- 2,612 posts
Member
Posted 28 July 2009 - 01:28 PM
I agree with you, a break of 79.07 would harden the concrete floor around this call.... I hate to use that term!!!
Gold breaking down (- $16) as of now and the foreign emerging markets ETF EEM breaking down as well are two other tell tale signs.
GS.
Edited by goldswinger, 28 July 2009 - 01:30 PM.


