Jump to content


Photo

Not even half way up...


  • Please log in to reply
2 replies to this topic

#1 Randy

Randy

    Member

  • Traders-Talk User
  • 58 posts

Posted 15 October 2009 - 02:57 PM

The unprecedented liquidity introduced into the financial system is finding its way into asset prices. Note the increase in Fed nonborrowed reserves at link below.

http://www.federalre...ses/h3/Current/

That said, this increase in stock prices we are experiencing is not unprecedented given the magnitude of the decline.


DOW_STO233_weekly_Oct09.jpg

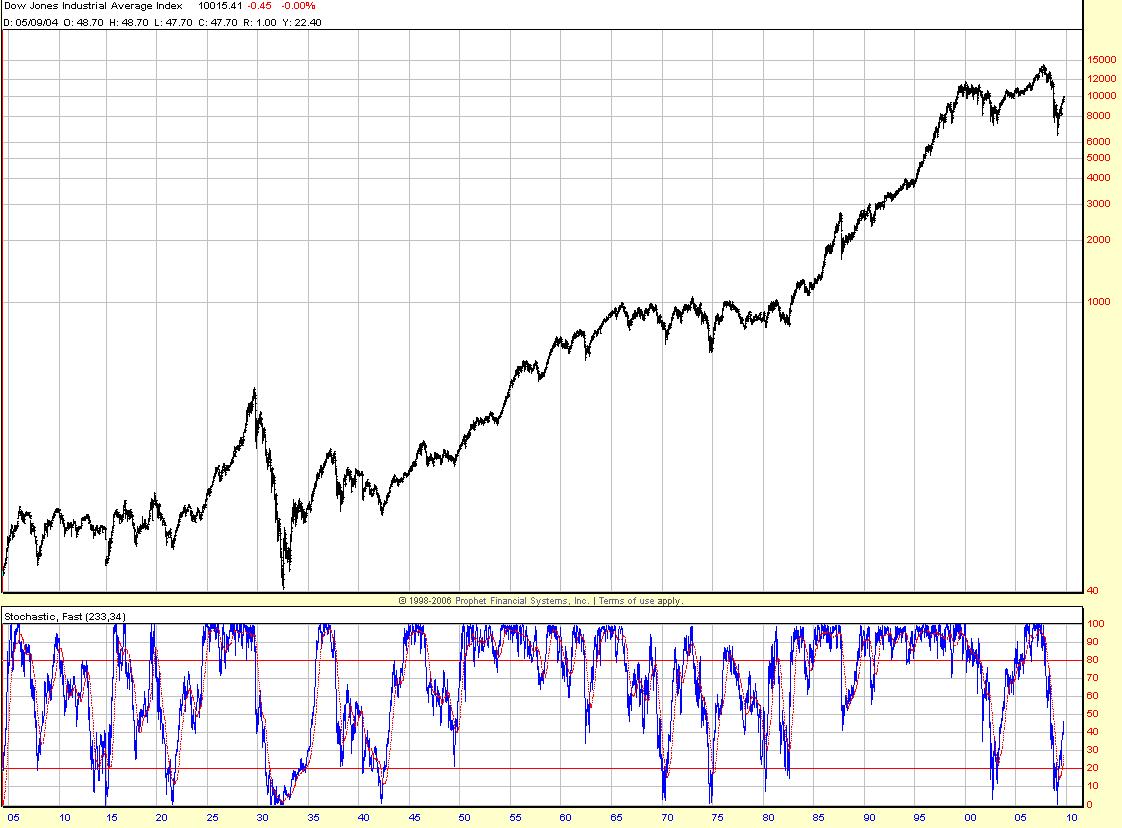
As measured against comparable declines over the last 100 years, we should climb to at least 80+ on 233sto. Note that this has often occurred with breathtaking speed.


SPX_PriceByVol.jpg


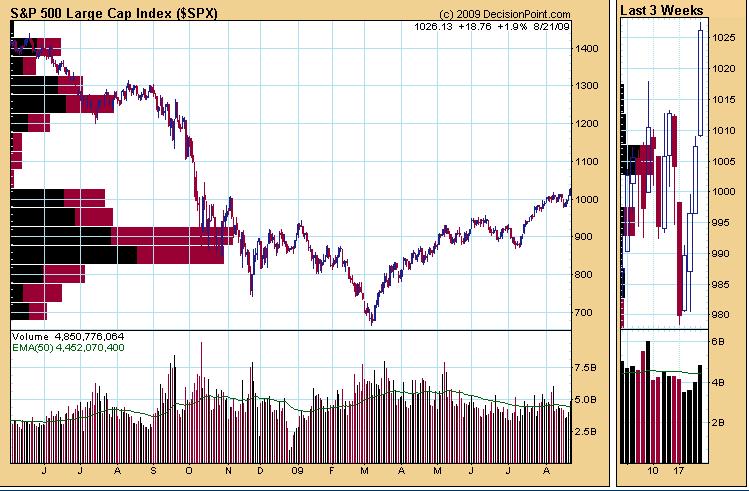
Price by volume since the Oct07 highs indicate the next 100 S&P points may not require as much work to get through.


In addition to above, I'm watching the following for indication of a significant intermediate term top:

Rydex_Mkt_102009.jpg

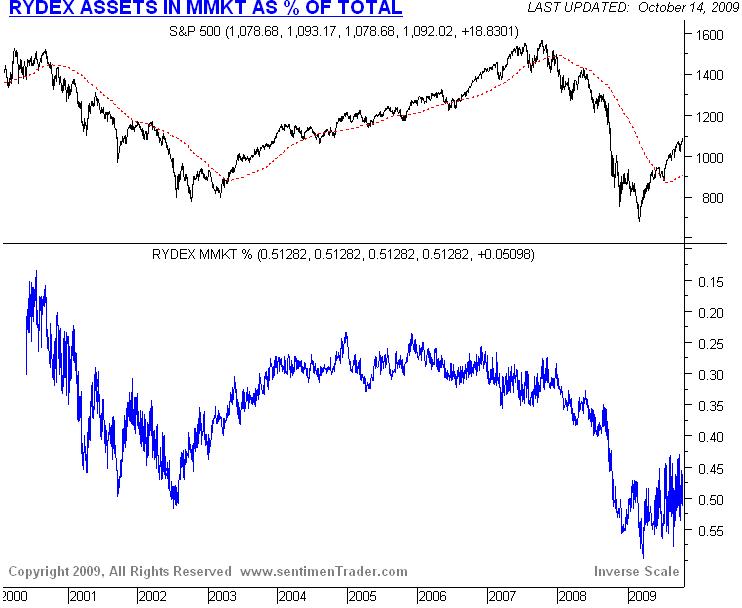
Rydex assets in money market are over 50% (similar to 2002 low). This should get below 30% before any significant top.

OEX_OpInt.jpg

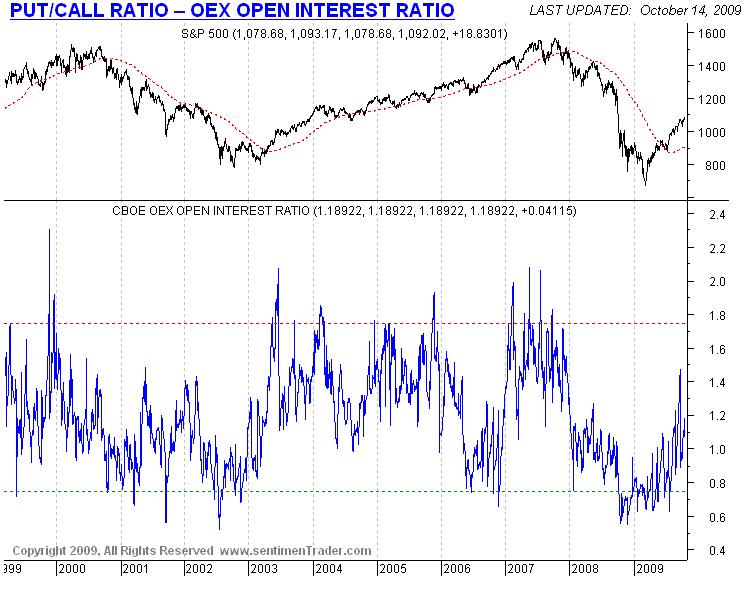
OEX open interest remains at relatively low levels. Note stabs to 1.8 to 2.0 precede significant tops.


As Stig points out above, we may now just be entering the seasonally strong end of year period that will continue to propel stocks higher....and even faster than many can imagine. All this, while unemployment continues to rise in the near-term.

#2 arbman

arbman

    Quant

  • Traders-Talk User
  • 19,504 posts

Posted 16 October 2009 - 11:03 AM

Randy, we are somewhere around 1935-1945 era in my opinion. The problem is we had the reckless borrowing AFTER the 1929 happened, I think the 1929 top was 2000-2001 top for US. So, the govt back then chose to go all the way and killed the credit on the way down and caused a depression.

This time they pumped up enormously to postpone the problem and deal with it over time, however it created another bubble. So, we had a lower low in the credit implosion. The most likely case here is we are topping and continue with the 1935-1945 pattern to NEW LOWS.

The banks would lend if they had the capital, in order to use the credit extended to them, they have to put 1:10th of their own capital.

Bank of America cannot make money even the money is free, they cannot even run a lemonade stand --by one of my partners description.


On the upside, your oscillators are definitely interesting though, I did some thinking if this sell off till the end of the month or early November given we are a little late in correcting this move does not break below 1000, then yes 1200-1220 will become the next target for some weird reason that I cannot figure out at the moment...

For now, I am just looking for a deeper correction to low 1000s at least, although today's sell off does not appear to be the beginning of it since the first dips may be bought one last time...

About 50-60% of the consumer economy comes from the small businesses and a new bull market cannot possibly begin while the govt does not know how to extend credit to the small businesses since the banks cannot perform, DO NOT TAKE THIS STATEMENT LIGHTLY.

Edited by arbman, 16 October 2009 - 11:05 AM.


#3 arbman

arbman

    Quant

  • Traders-Talk User
  • 19,504 posts

Posted 16 October 2009 - 11:59 AM

For now, I am just looking for a deeper correction to low 1000s at least, although today's sell off does not appear to be the beginning of it since the first dips may be bought one last time...


To be clear, I will be adding to my short positions if this reverses back up from here to new highs in the days ahead, 1120-1140 being my stop line.