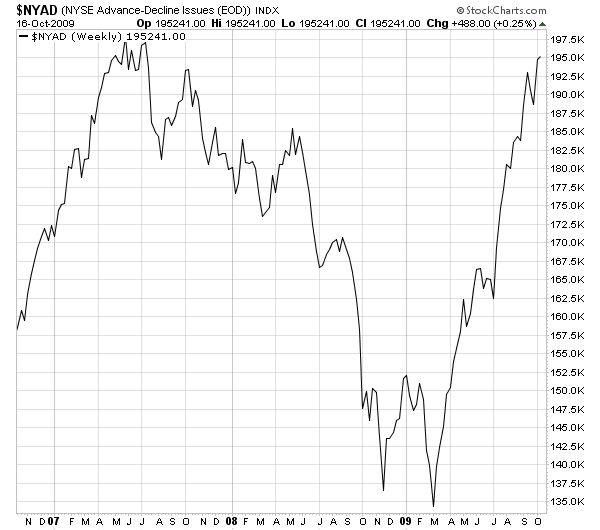

Double Top on $NYAD weekly?
Started by
beahero
, Oct 16 2009 09:44 PM
9 replies to this topic
#2

redfoliage2
-

- Traders-Talk User
- 19,897 posts
Member
Posted 16 October 2009 - 10:17 PM
I also noticed this cumulative NYAD topping pattern and it's very scaring if you are long stocks .........

#3
snorkels4
-

- Traders-Talk User
- 2,677 posts
bad guy
Posted 16 October 2009 - 10:18 PM
thrust
http://stockcharts.com/h-sc/ui?s=$NYA...id=p22476102328
http://stockcharts.com/h-sc/ui?s=$NYA...id=p22476102328
Edited by snorkels4, 16 October 2009 - 10:19 PM.
Andy House, Texas Man, Accidentally Drives 2006 Bugatti Veyron Into Salt Marsh
http://www.zimbio.co...Veyron Crashing
http://www.zimbio.co...Veyron Crashing
#4
diogenes227
-

- TT Patron+
- 5,120 posts
Member
Posted 16 October 2009 - 11:19 PM
No.
Just because it's in the territory doesn't mean it's there. Has to turn down. With conviction.
But, in retrospect, what a luscious washout double bottom that was!

"If you've heard this story before, don't stop me because I'd like to hear it again," Groucho Marx (on market history?).
“I've learned in options trading simple is best and the obvious is often the most elusive to recognize.”
"The god of trading rewards persistence, experience and discipline, and absolutely nothing else."
#5
voltaire
-

- Traders-Talk User
- 1,134 posts
Member
Posted 16 October 2009 - 11:49 PM
That double top to double bottom decline is 19 months and fits with Laundry's target of August 2010 as the major rally high, based on then 19 months up from just after the start of 2009.
Currently 2 of 3 T's have just expired and 1 allows 3-5 more days up.
A low around end of Nov also generates a longer term T that would also target Aug next year.
I have to admit that my cycles disagree and suggest the top is now and obviously any new leg up after a pullback becomes 5 waves and suggests a new bull market.
We have had 99 cal days up and when it comes from an interim low (July 8) if it holds then often a nasty 56 cal day decine follows. OK, allow a couple of days but you can look at 2007 or even 1987 and plenty of other examples.
#6
voltaire
-
- Traders-Talk User
- 1,134 posts
Member
Posted 17 October 2009 - 04:38 AM
That double top to double bottom decline is 19 months and fits with Laundry's target of August 2010 as the major rally high, based on then 19 months up from just after the start of 2009.
Currently 2 of 3 T's have just expired and 1 allows 3-5 more days up.
A low around end of Nov also generates a longer term T that would also target Aug next year.
I have to admit that my cycles disagree and suggest the top is now and obviously any new leg up after a pullback becomes 5 waves and suggests a new bull market.
We have had 99 cal days up and when it comes from an interim low (July 8) if it holds then often a nasty 56 cal day decine follows. OK, allow a couple of days but you can look at 2007 or even 1987 and plenty of other examples.
The ideal rally and decline is 99 cal up and 56 cal down but it isn't always perfect.
In 1987 it was 97 cal up from the May 20 low to the Aug 25 high and 56 cal down to the Oct 20 crash low. 153 days low to low.
In 2007 it was 98 cal up from the Mar 14 low (and yes there was a higher high later) and 57 cal down into the Aug 16 panic low where the FED stepped in. 155 days low to low.
The combined low to low ideal is 155 cal days which is a pyramid based "secret" number.
155 cal from July 8, if Oct 15 holds to make it all legit is Dec 10 for the idealised low.
#7
fib_1618
-

- Traders-Talk User
- 10,301 posts
Member
Posted 17 October 2009 - 08:50 AM
Daily, Weekly, it really doesn't matter...your answer lies in comparing the structure and amplitude of the NYSE MCSUM between the two periods.Double Top on $NYAD weekly?
With that said, however, the technical expectation for some time now is for some sort of hesitation at or near the 2007 highs.
Fib
Better to ignore me than abhor me.
“Wise men don't need advice. Fools won't take it” - Benjamin Franklin
"Beware of false knowledge; it is more dangerous than ignorance" - George Bernard Shaw
Demagogue: A leader who makes use of popular prejudices, false claims and promises in order to gain power.
#8
beahero
-
- Traders-Talk User
- 162 posts
Member
Posted 17 October 2009 - 09:25 AM
...at or near the 2007 highs.
Sure looks to me like that's where we are now...
#9
fib_1618
-
- Traders-Talk User
- 10,301 posts
Member
Posted 17 October 2009 - 10:18 AM
Yes, but hesitation doesn't mean top...it means (technical) pause.Sure looks to me like that's where we are now...
Think of it as a (possible) regrouping of the troops after taking back land lost before going into uncharted territory...or a football team taking a time out near the goal line after a long drive from their own 5 yard line.
Fib
Better to ignore me than abhor me.
“Wise men don't need advice. Fools won't take it” - Benjamin Franklin
"Beware of false knowledge; it is more dangerous than ignorance" - George Bernard Shaw
Demagogue: A leader who makes use of popular prejudices, false claims and promises in order to gain power.
#10
voltaire
-
- Traders-Talk User
- 1,134 posts
Member
Posted 17 October 2009 - 10:42 AM
That double top to double bottom decline is 19 months and fits with Laundry's target of August 2010 as the major rally high, based on then 19 months up from just after the start of 2009.
Currently 2 of 3 T's have just expired and 1 allows 3-5 more days up.
A low around end of Nov also generates a longer term T that would also target Aug next year.
I have to admit that my cycles disagree and suggest the top is now and obviously any new leg up after a pullback becomes 5 waves and suggests a new bull market.
We have had 99 cal days up and when it comes from an interim low (July 8) if it holds then often a nasty 56 cal day decine follows. OK, allow a couple of days but you can look at 2007 or even 1987 and plenty of other examples.
The ideal rally and decline is 99 cal up and 56 cal down but it isn't always perfect.
In 1987 it was 97 cal up from the May 20 low to the Aug 25 high and 56 cal down to the Oct 20 crash low. 153 days low to low.
In 2007 it was 98 cal up from the Mar 14 low (and yes there was a higher high later) and 57 cal down into the Aug 16 panic low where the FED stepped in. 155 days low to low.
The combined low to low ideal is 155 cal days which is a pyramid based "secret" number.
155 cal from July 8, if Oct 15 holds to make it all legit is Dec 10 for the idealised low.
If Laundry is correct then this up move lasts till August next year.
In fact he already has a T in force that measures to 22/08/10. (dates are english dd/mm/yy).
Another T is building from Mar 18 and if you want that to generate the same target it needs to have a centre post about 4/12/2009.
That could be a V bottom but most seem to have a divergent bottom which he then bisects. The second and divergent bottom is of course the price low.
Lets say the divergent bottoms are a couple of weeks apart then we could have a price low around 10/12/2009, after the momentum low was say 26/11/08. That gives a centre post about Dec 4.
Of course that 10/12/09 price fits the 56 day down idea I have been suggesting as a possibility.


