Jump to content


Photo

Monthly Gold Chart


  • Please log in to reply
3 replies to this topic

#1 IndexTrader

IndexTrader

    Member

  • TT Patron+
  • 7,694 posts

Posted 11 November 2009 - 12:03 PM

The chart is from http://www.the-privateer.com/gold.html. Alot of good gold information there. I've been going to this site since around 2000 or so. Charts available in other currencies, such as euro, yen, and aussie dollar. Gold is moving well in terms of both the euro and yen.

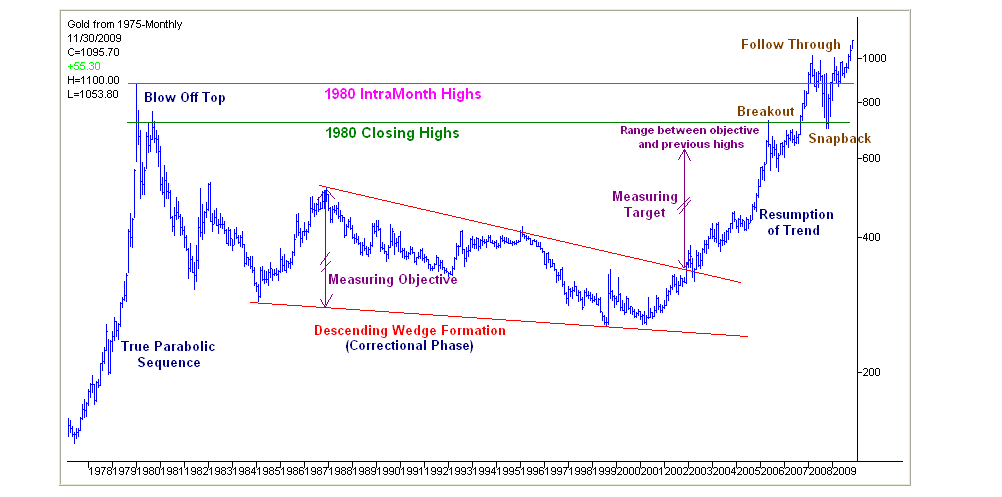
There's alot of objectives from the gold chart. I mentioned a week or two ago here that I had a short term target of 1117. But I have much higher targets as well. 1300 is one that stands out that is somewhat nearby. Obviously though, we'll have corrections. And as I've said before, targets are kinda like parlor tricks...there're great when they work.

IT

[attachment=13898:Monthly_Gold_Chart.png]

Edited by IndexTrader, 11 November 2009 - 12:04 PM.


#2 fib_1618

fib_1618

    Member

  • Traders-Talk User
  • 10,301 posts

Posted 11 November 2009 - 12:53 PM

(price) targets are kinda like parlor tricks..

I would maintain that without these same targets we would all be trading fundamentally (which is another way to say aimlessly).

TA 104 analysis follows.

Fib

Posted Image

Better to ignore me than abhor me.

“Wise men don't need advice. Fools won't take it” - Benjamin Franklin


"Beware of false knowledge; it is more dangerous than ignorance" - George Bernard Shaw


Demagogue: A leader who makes use of popular prejudices, false claims and promises in order to gain power.


#3 Islander

Islander

    Member

  • Traders-Talk User
  • 2,551 posts

Posted 11 November 2009 - 12:56 PM

Good Review, I share your believe that higher gold is inevitable, like it or not. With the future of the dollar assuredly lower, gold and other currencies and even good equities are the place to be until the dollar is at about 40, which to say, collasped. The long run gold price is much higher 1300, 2000, who knows? Silver may do even better, its cheaper so to speak. The Congress has no respect for asset values, or the dollar. Best, Islander.

#4 Cirrus

Cirrus

    Member

  • TT Patron+
  • 5,735 posts

Posted 11 November 2009 - 01:38 PM

Looking at VLT gold charts in terms of the DOW is interesting, as well (Dow/gold ratio). The secular peaks for the ration have seem to alternate between 2 and 1. The last was a one so perhaps a 2 is coming. My guess is we get there with the typical parabolic type move the "in" asset or group seems to display in manias.