Jump to content


Photo

OK. This ain't July's rally.


  • Please log in to reply
7 replies to this topic

#1 Rogerdodger

Rogerdodger

    Member

  • TT Member*
  • 26,991 posts

Posted 12 November 2009 - 08:33 PM

Decision Point:


At this point, I am still expecting a price low at the end of this month based on the 20-Week Cycle low projection, but it doesn't look as if the price correction will be too severe. My reasoning is that so far short-term oversold conditions are generating very strong bounces. Of course, this could change in a heart beat, so keep an eye on it.

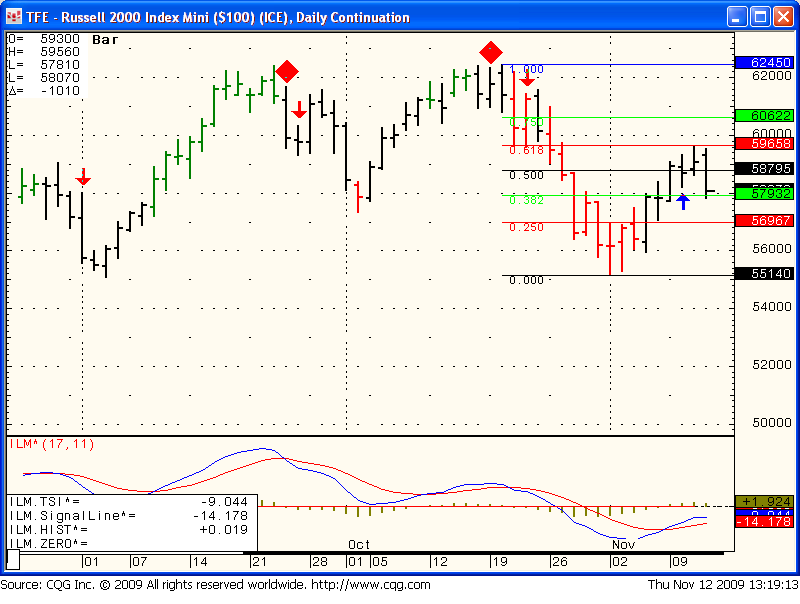
Technically speaking, we do not yet have a down trend -- we need a lower high and a lower low.


We got the lower high and lower low finally.

Laundry:


Download Latest T Theory Chart and Data

Thursday Nov 12th Comment: Failure to carry through is disappointing. The AD Line double bottom should hold but if it doesn't my original forecast of a late Nov low at the lower green envelop may result.


This looks like it's gotta drop:
Posted Image

Tick tried but NYMO didn't go.
http://stockcharts.com/c-sc/sc?s=$TICK&p=D&yr=1&mn=0&dy=0&i=p59190029457&a=112527926&r=6308.png

#2 NAV

NAV

    Member

  • Traders-Talk User
  • 16,087 posts

Posted 12 November 2009 - 10:15 PM

We got the lower high and lower low finally.


Where do you see a lower high and lower low ? Which index ? Certainly not on SPX.

"It's not the knowing that is difficult, but the doing"


https://twitter.com/Trader_NAV


#3 Rogerdodger

Rogerdodger

    Member

  • TT Member*
  • 26,991 posts

Posted 12 November 2009 - 11:05 PM

We got the lower high and lower low finally.


Where do you see a lower high and lower low ? Which index ? Certainly not on SPX.

:huh:

Hit your "Refresh" button.

SPX:
11/11/09: High 1105.37 low 1093.81
11/12/09: High 1101.97 low 1084.90

Look here: LINK
Look for red "SELL CONFIRMED"

#4 NAV

NAV

    Member

  • Traders-Talk User
  • 16,087 posts

Posted 12 November 2009 - 11:11 PM

We got the lower high and lower low finally.


Where do you see a lower high and lower low ? Which index ? Certainly not on SPX.

:huh:

Hit your "Refresh" button.

SPX:
11/11/09: High 1105.37 low 1093.81
11/12/09: High 1101.97 low 1084.90

Look here: LINK
Look for red "SELL CONFIRMED"


Got it. You are talking about the hourly charts. I was looking at the swing high-lows on the daily charts.

"It's not the knowing that is difficult, but the doing"


https://twitter.com/Trader_NAV


#5 Rogerdodger

Rogerdodger

    Member

  • TT Member*
  • 26,991 posts

Posted 12 November 2009 - 11:14 PM

Got it. You are talking about the hourly charts. I was looking at the swing high-lows on the daily charts.


I figured that. No down trend confirmation for sure.
But heck at least it finally had one down day.
It's a start. <_<

Edited by Rogerdodger, 12 November 2009 - 11:21 PM.


#6 Rogerdodger

Rogerdodger

    Member

  • TT Member*
  • 26,991 posts

Posted 12 November 2009 - 11:30 PM

I noticed this comment at American Bulls where several stocks recently formed a bullish pattern which failed:

"The market is an inviting one for short-sellers. Risk lovers may now go for short sale. The market is already moving on the side of shorts ignoring the confirmed bullish patterns."

#7 NAV

NAV

    Member

  • Traders-Talk User
  • 16,087 posts

Posted 13 November 2009 - 12:36 AM

Got it. You are talking about the hourly charts. I was looking at the swing high-lows on the daily charts.


I figured that. No down trend confirmation for sure.
But heck at least it finally had one down day.
It's a start. <_<


RUT is one of the indexes which is already in a daily downtrend with lower highs and lower lows on the daily charts, one which bulls would dismiss as not significant. Yesterday, it gave a continuation sell on the daily.

"It's not the knowing that is difficult, but the doing"


https://twitter.com/Trader_NAV


#8 beahero

beahero

    Member

  • Traders-Talk User
  • 162 posts

Posted 13 November 2009 - 08:55 AM

RUT is one of the indexes which is already in a daily downtrend with lower highs and lower lows on the daily charts, one which bulls would dismiss as not significant. Yesterday, it gave a continuation sell on the daily.


As I've been faithfully pointing out for the past four weeks. Here's the chart I posted last night.

Attached Thumbnails

  • TF.png