

May be time to short
Started by
CLK
, Nov 13 2009 05:14 AM
4 replies to this topic
#1

CLK
-
- Traders-Talk User
- 10,823 posts
Member
Posted 13 November 2009 - 05:14 AM
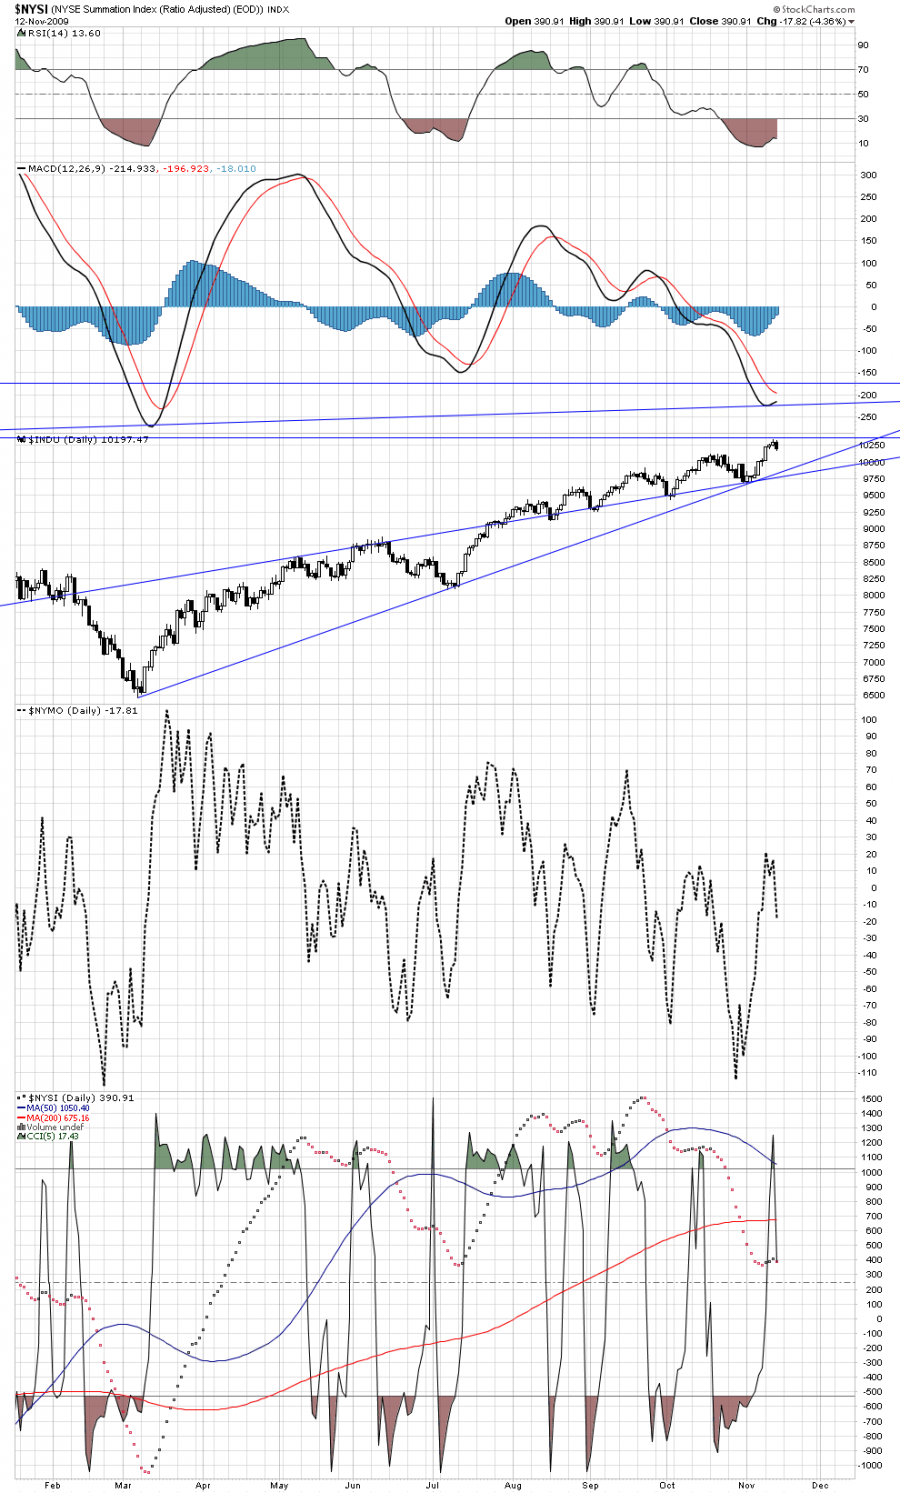
I can hardly believe it but NYSI has failed at this extreme low
and fish hooked.
I'm not looking for March retrace and all
like others here, maybe 300-400 Dow points.
#2
goldswinger
-

- Traders-Talk User
- 2,612 posts
Member
Posted 13 November 2009 - 09:46 AM
I can hardly believe it but NYSI has failed at this extreme low
and fish hooked.
I'm not looking for March retrace and all
like others here, maybe 300-400 Dow points.
I actually expected it to fail on this fake of all fakes rally. Negative divergences everywhere....
GS.
#3
tommyt
-

- Traders-Talk User
- 5,136 posts
Member
Posted 13 November 2009 - 10:01 AM
there goes the breadth again...we opened up small and had 2:1 positive breadth...now we back to flat and breadth fairly negative.
#4
Data
-

- Validating
- 2,618 posts
Member
Posted 13 November 2009 - 10:51 AM
Summation Index seemed to do the same negative non-conformationin 2003 and 2004. It didn't lead to big declines.
Money Flow Index (6) has been an effective swing indicator. The default number of days on Stockcharts is 14. So you'll have to set it to 6.
http://stockcharts.com/h-sc/ui?s=spy
Money Flow Index (6) has been an effective swing indicator. The default number of days on Stockcharts is 14. So you'll have to set it to 6.
http://stockcharts.com/h-sc/ui?s=spy
#5
porsche911sg
-

- Traders-Talk User
- 2,907 posts
Member
Posted 13 November 2009 - 11:14 AM
GS, Looks entirely fake...heavy plunge lies ahead.
Seldom do i see one this bad.
The market catches almost everyone on the wrong side. We always seem to get fake break out before that huge dump or the hugh dump before the false break down! Trade Safe!


