
17 is the number
Started by
voltaire
, Nov 16 2009 04:57 AM
No replies to this topic
#1

voltaire
-
- Traders-Talk User
- 1,134 posts
Member
Posted 16 November 2009 - 04:57 AM
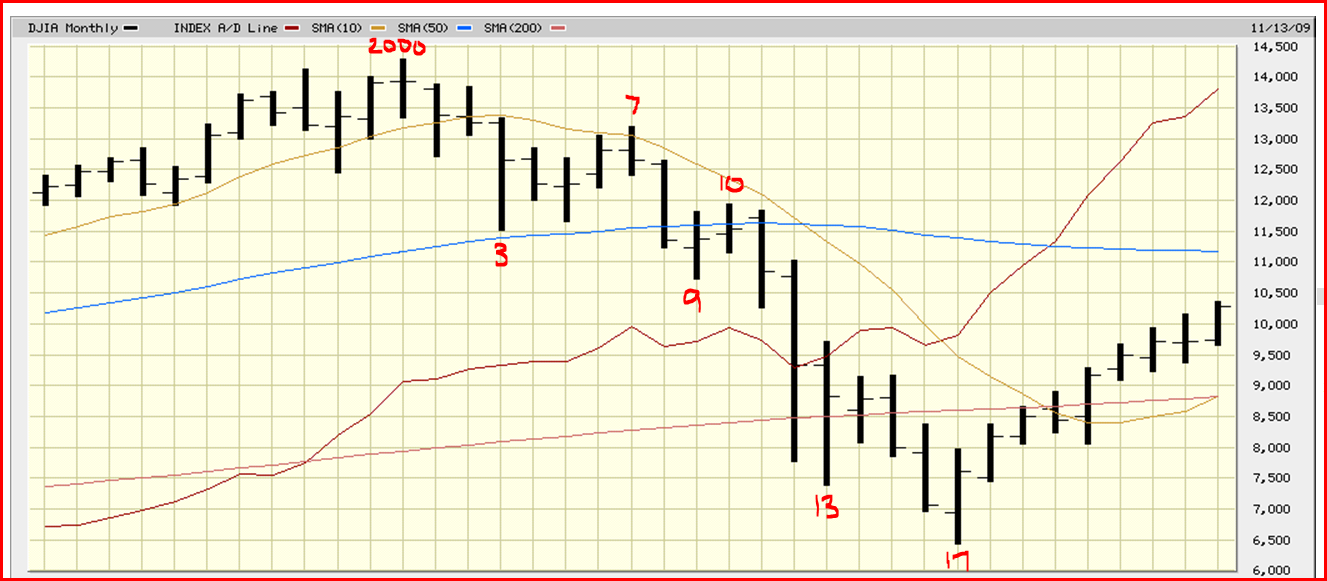
US markets seem to have a tendency to 17 years bull and 17 years bear/sideways and repeat.
So we have about 1966-1983 bear and 1983-2000 bull and now is it 2000-2017 bear?
Hey, but we just had a 17 month bear so what if that is some sort of fractal at least in turns.
The DJIA monthly chart turns Oct 2007 into the year 2000 and the turns since have been pretty good.
By the way, I have always had 2013 as the major low.


