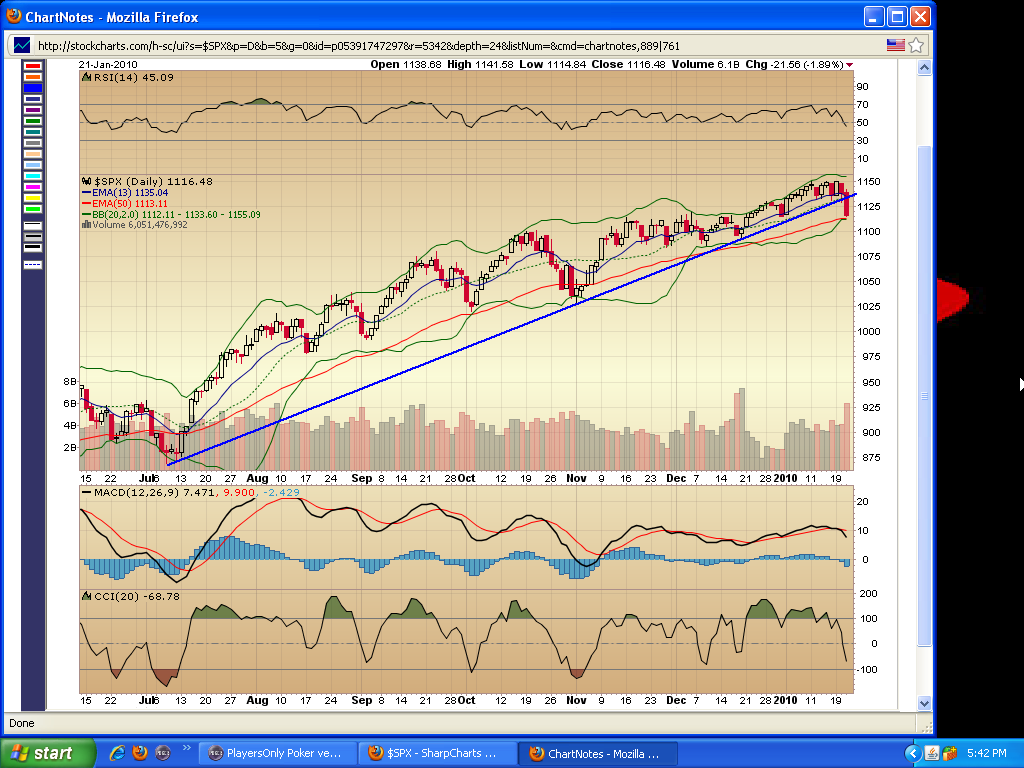

The way i see it, we have a seven month trend change.
Started by
capgain55
, Jan 21 2010 05:59 PM
3 replies to this topic
#2

fib_1618
-

- Traders-Talk User
- 10,301 posts
Member
Posted 21 January 2010 - 07:06 PM
From the breadth and volume side of things, we're still showing corrective activity.
I would also like to caution everyone that the market is NOT in sync to the downside with the greater chunk of the decline coming with the high cap stocks while the mid and small caps are slightly ahead of overall breadth.
In other words, price is leading breadth, and it's the highly weighted issues that are causing subterfuge.
Internally, we are now at a point in which a bounce should be seen on Friday with a higher close. And with the internal compression as it is right now, it wouldn't be too surprising if we see new recovery highs by the middle part of next week.
The one thing that the bears should appreciate is that the upward trend of money flow was starting to show fatigue all of last week and was due for some sort of an exhaustion point. This is a good starting point for a more appreciable correction yet to come, but it's only a first step...more time will be needed before we see something worth hanging our collective hats on for more than a day or two.
Fib
Better to ignore me than abhor me.
“Wise men don't need advice. Fools won't take it” - Benjamin Franklin
"Beware of false knowledge; it is more dangerous than ignorance" - George Bernard Shaw
Demagogue: A leader who makes use of popular prejudices, false claims and promises in order to gain power.
#3
hiker
-

- TT Member*
-

- 12,118 posts
independent trader
Posted 21 January 2010 - 07:16 PM
"I would also like to caution everyone that the market is NOT in sync to the downside with the greater chunk of the decline coming with the high cap stocks while the mid and small caps are slightly ahead of overall breadth."
-------------
hi Fib,
* when looking at the current weekly XBD and BKX charts, I see a high level consolidation pattern now in play ... nothing but holding steady action in play for a few weeks in these two groups, in spite of GS's love affair with testing the $158 to 165 price zone
* the late December daily close lows for INDU and TRAN were slightly broken by today's close, with the earlier December daily close lows now easily within reach if price wants to continue down for INDU and TRAN ... a move below the INDU and TRAN November close lows would likely confirm a Dow Theory sell signal, and these price levels remain some distance below.
cheers, -hiker
Edited by hiker, 21 January 2010 - 07:26 PM.
#4
thespookyone
-

- Traders-Talk User
- 6,043 posts
Member
Posted 21 January 2010 - 08:19 PM
"we're still showing corrective activity"
3-3-5, Agree.


