
Violated on the Close
Started by
Iblayz
, Jan 22 2010 05:15 PM
5 replies to this topic
#1

Iblayz
-
- TT Patron+
- 1,033 posts
Member
Posted 22 January 2010 - 05:15 PM
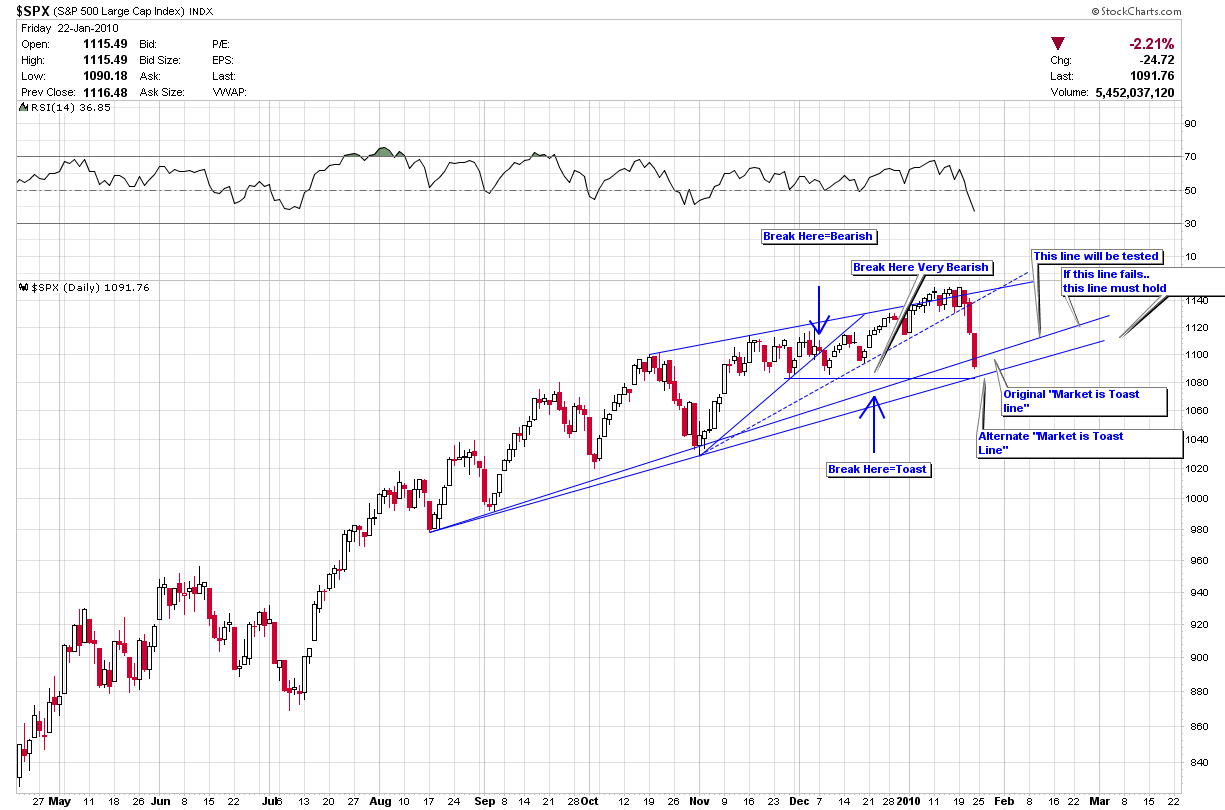
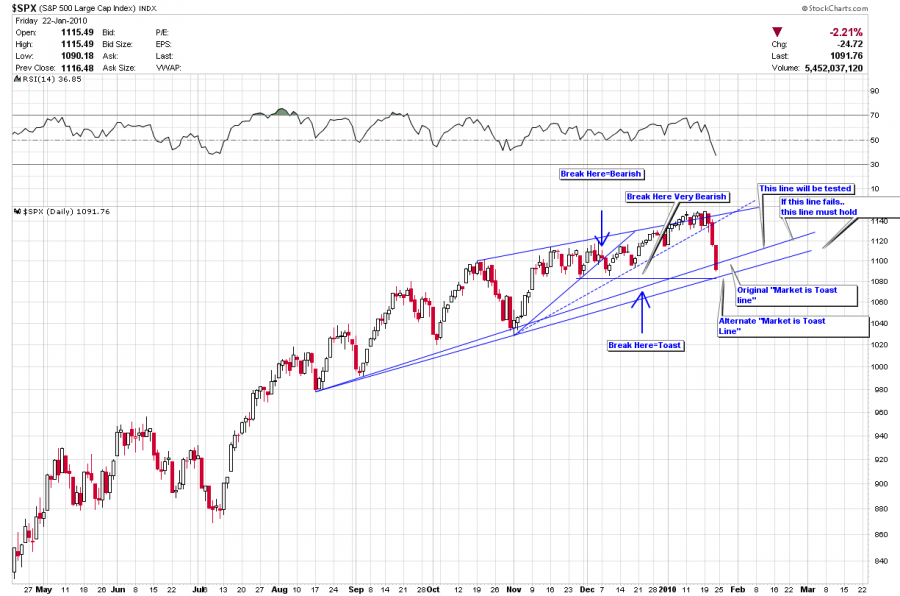
Tinkered with it a bit during the day to get it right where I wanted it....Intersecting the August 17th low, the September 3rd low and showing the intraday violations on October 30th, November 2nd and 3rd absent a closing violation. In my opinion, this is the line that matters.....and its a big one. The DOW busted the same line. The NYA even busted the alternate line drawn through August and Novembers lows.....and closed below it. NDX isn't there yet. IMO that won't matter but should provide some excitement.
#2
qqqqtrdr
-

- Traders-Talk User
- 3,251 posts
Member
Posted 22 January 2010 - 05:32 PM
Looks like a bottom is close to being at hand here, but not quite yet... Volume was large, but advanced/declines improved. Short term charts are now oversold, but we violated the 50-day MA... If we bounce Monday with bullish OEX Put/Call it is a buy...
Barry
#3
capgain55
-

- Traders-Talk User
- 197 posts
Member
Posted 22 January 2010 - 05:36 PM
Tinkered with it a bit during the day to get it right where I wanted it....Intersecting the August 17th low, the September 3rd low and showing the intraday violations on October 30th, November 2nd and 3rd absent a closing violation. In my opinion, this is the line that matters.....and its a big one. The DOW busted the same line. The NYA even busted the alternate line drawn through August and Novembers lows.....and closed below it. NDX isn't there yet. IMO that won't matter but should provide some excitement.
Nice chart, I've always been a believer in basic TLs and a few simple indicators. To me the simple things are more meaningful than most of the confusing stuff lol!
cap.
#4
blackprince
-

- Traders-Talk User
- 209 posts
Member
Posted 22 January 2010 - 05:41 PM
The Oct and Nov lows will be tested before any kind of rally ensues.
#5
Iblayz
-
- TT Patron+
- 1,033 posts
Member
Posted 22 January 2010 - 05:51 PM
Looks like a bottom is close to being at hand here, but not quite yet... Volume was large, but advanced/declines improved. Short term charts are now oversold, but we violated the 50-day MA... If we bounce Monday with bullish OEX Put/Call it is a buy...
Barry
I agree that we are close to a bottom....at least in the manner that they have been working. The question is.....is it going to work like it has been working. That chart says.....No! Maybe they touch the alternative SPX "toast" line and then backtest the first one....maybe not. I believe its broken.
And thanks Cap.
Edited by Iblayz, 22 January 2010 - 05:52 PM.
#6
andiron
-

- Traders-Talk User
- 5,757 posts
Member
Posted 22 January 2010 - 07:43 PM
if a bounce pierces ES1125 on the upside, many including me will be hugely surprised..not to say, then 1200+ would be a cert.


