
[ref 1]: Apr 29 2009, 03:23 PM
---------------------------------------------------------------------------------------------
link
By surmounting 881 [see note], the wave hierarchy changes. The rally wave since March 6th becomes a major wave. Therefore, a primary wave B (Up, counter-trend) has commenced. It is at the same level as the wave from Oct/07 to March/09 (Primary A, Down).
[Note]:
881.38 = [0.236|666.79:1576.09] and 877= [0.618|1007:667]. The points between 877 [middle spring target] and 881 is small but By surmounting 881, the wave hierarchy changes
---------------------------------------------------------------------------------------------
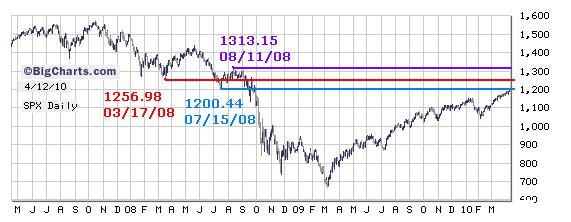
Index challenged the 1200.44, a low point marked on July 15, 2008. This is a In-Progress movement. When index exceeds 1256.98 (refer to the chart shown below) the wave status since March 09 may separate from the prior one (1756-->667) and become an individual segment (see note). When the wave is becoming a separate segment, it is capable of reaching 1300 level. The half power point 0.707 from 667 to 1576 is 1310, very close to the High 1313.15 marked on 08/11/08.
[note]: Feb 14 2010, 07:36 PM
http://indexcalls.co...o...st&p=556709
One of the issues in E-wave theory is the connectivity. E-wave theory is a set of an intuitive hypothesis (a proposed explanation for an observable phenomenon). Obviously, the more separation in time of two non-connected groups of waves, the lesser the associability in between. When two groups of waves connect together, still, the doubt is whether we need to treat these waves in the context of one segmentation. In short, the E-wave theory may be applicable only to a discrete segment in a given time interval. For example, the wave since late March may be can only be interpolated and extrapolated in its own territory. Not much adherence with the prior move.
I do believe E-wave theory is a guide to explore a segmental rhythms, It is an alternative interpretation for the following quote:
link
Mark Twain 1835-1910
By law of periodical repetition, everything which has happened once must happen again and again -- and not capriciously, but at regular periods, and each thing in its own period, not another's and each obeying its own law.
[ref 2]:Sep 7 2009, 01:46 PM
---------------------------------------------------------------------------------------------
link
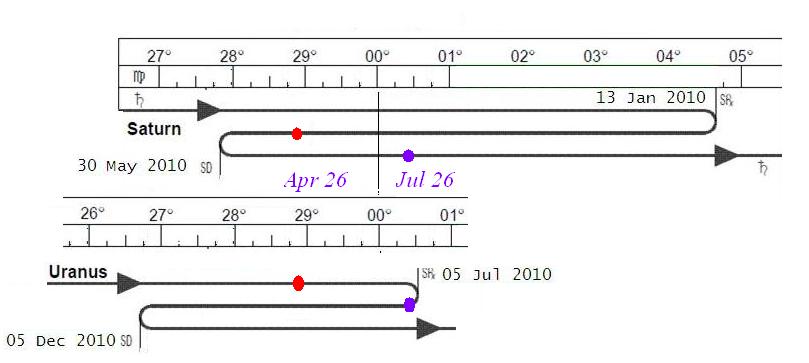
Astro events can hardly ties with a quantitative number credibly. While those hard planet aspects may drag down the index, the wave structure since Marchs low (09) looks bullish.
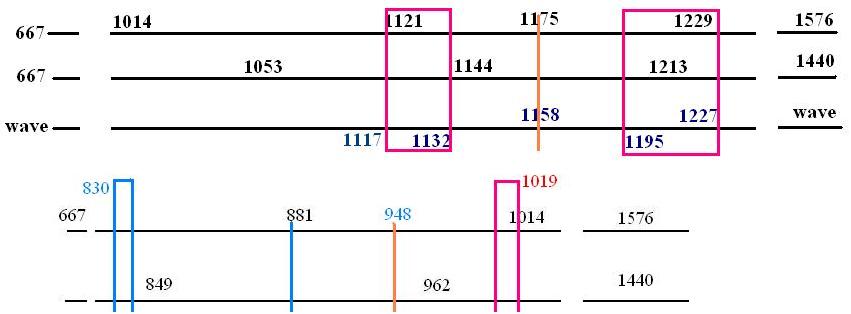
I speculate there is a possibility we will see the Up wave bring the index to somewhere around 1122 to 1229.
---------------------------------------------------------------------------------------------
In late September, I picked two retracement references out of [667:1575] for speculation:
1122 is the 50% retracement, befroe index took out 1132 decesively, there was a month long tough fight in the zone 1086-1132.
1229 is the 61.8% retracements, Zone 1195 to 1229 should be another battle field.
Larger frame pullback targets: There is no sign of weakening, Bull has gained enough high terrain so that a regular 0.382 pullback from 1229 only can reach 1014 [frame 667:1229], 0.5 @948.
[ref 3]: Nov 29 2009, 02:51 AM
---------------------------------------------------------------------------------------------
link
666.79-->956.23-->869.32-->1158.53 [1.0]
---------------------------------------------------------------------------------------------
A few technicians suggest 1269 to be the next high target.
666.79-->956.23-->869.32-->1158.53 [1.0]--->1227.06[1.236]-->1269.33[1.382].
However, 1221 is a major Fibonacci retracement point, expects good rejection on initial assault.
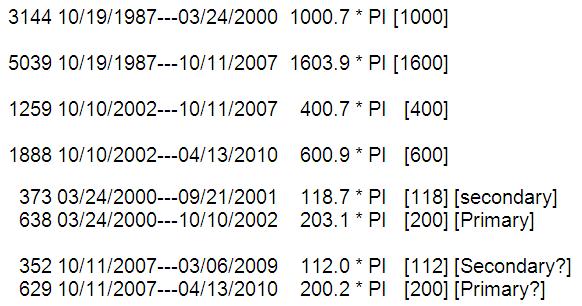
According to the Long PI projection, Index may plot a peak around 04/15, [center 04/15, +/- 4 * PI], One may anticipate this event, but not to make heavy bet on it;
[ref 4]: Jan 30 2010, 09:56 PM
---------------------------------------------------------------------------------------------
link
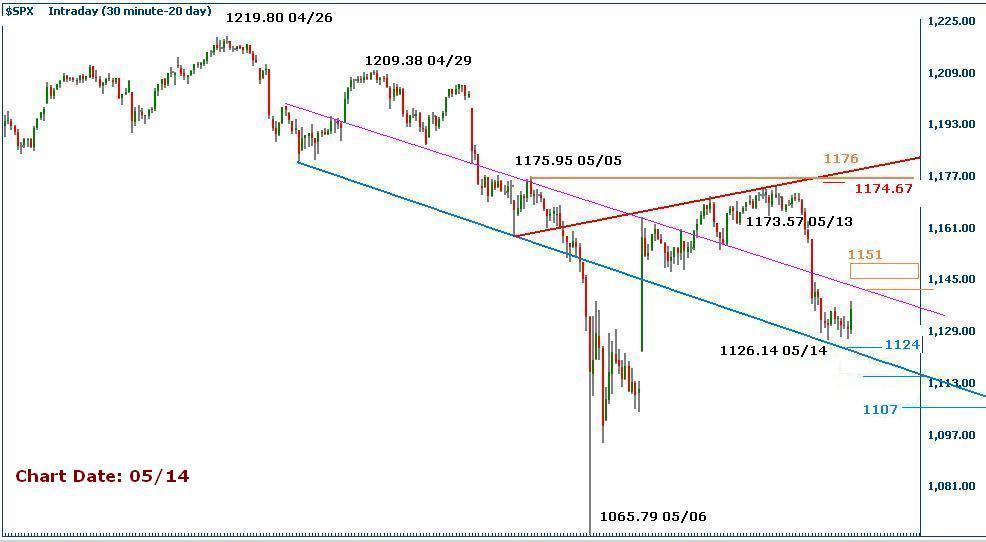
Index surmounts 1132 will invalidate the downward correction, pivot 1119. Supports 1062/1064, 1043/1036, 1001.
Market moved ahead of itself due to the economy has moved from dire state to a relative mix of signals stage. Unless fundamental conditions turn down again quickly, we may see index run into some sort of correction, not a full speed downward movement
---------------------------------------------------------------------------------------------
[Ref 5]: Dec 31 2009, 03:51 PM
---------------------------------------------------------------------------------------------
link
The turn date on 03/01 is sandwiched by 01/18/10 (Fibonacci Time Zone 0.618) and 04/15/10 (long PI date), the index action in this period provides a good perception for the rest of the 2010. By that time, we may feel the beginning of something. The prelude for the alignment of our times.
---------------------------------------------------------------------------------------------
Index reversed from 1044.5 then jumped over pivot 1119 on 03/05. That Jump-Over-Pivot action pretty much set the tone and confirmed the Bradley turn date direction. Now, index poked into zone 1195-1229. In a near term time frame, I guess we may see a pullback to test 1045-1003, pivot 1085, then head to challenge 1200 again. Right now, Index attempts to assault the lower side of the target zone 1195-1229. Put in this way: Without good earnings outlook, the Gap-Up technology can hardly send the index over 1229 in near term. The bet is counting on how much realization a speculator has gained in the fundamental front.


