

It has been one of the indicators which kept this old bear bullish...until mid April when it hit an extreme and turned up.
However it is yet to turn down and is still bearish.
"OK, so what now? Hell if I know."
Great minds think alike.
I'd be inclined to buy a gap down Monday for a pop.
Next week is typically up, but cracks are beginning to show.
One chart which has kept me on the bullish side (until Wednesday night) is the CPC.
http://www.traders-t...howtopic=118209http://stockcharts.com/c-sc/sc?s=$CPC&p=D&yr=3&mn=0&dy=0&i=p96797995968&a=31062200&r=9443.pngCPC extreme today like the Jan top
0.56 is the lowest in years.
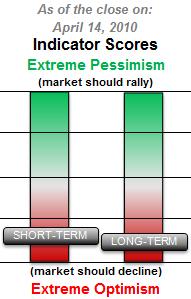
Sentimentrader showed a big jump Friday along with TRIN:

Tick is another one which is showing no life. Today's closing tick was a very low -822.
It's beginning to look a bit like the July '09 correction which I've mentioned before.
http://stockcharts.com/c-sc/sc?s=$TICK&p=D&yr=1&mn=0&dy=0&i=p90549519776&a=112527926&r=1974.png
And today's 5 day TRIN total is 9.46 and that's without any panic type spikes. Today's high was only a 2.71. LINK
So it's a weak, oversold market and should bounce but sovereign debt concerns are the big market weight not soon to vanish.
http://stockcharts.com/c-sc/sc?s=$SPX&p=D&yr=1&mn=0&dy=0&i=p41598787793&a=94546561&r=1275.png
Edited by Rogerdodger, 18 May 2010 - 03:35 PM.


