http://www.traders-t...howtopic=118997
the last thing this market needs is for a war to start...
letss see what else is on deck..
obama to talk in 20 minutes about getting tough on banks
senate vote tomorrow on financial reform bill
german referndum on greece bailout..
something really ugly is going to happen this weekend...
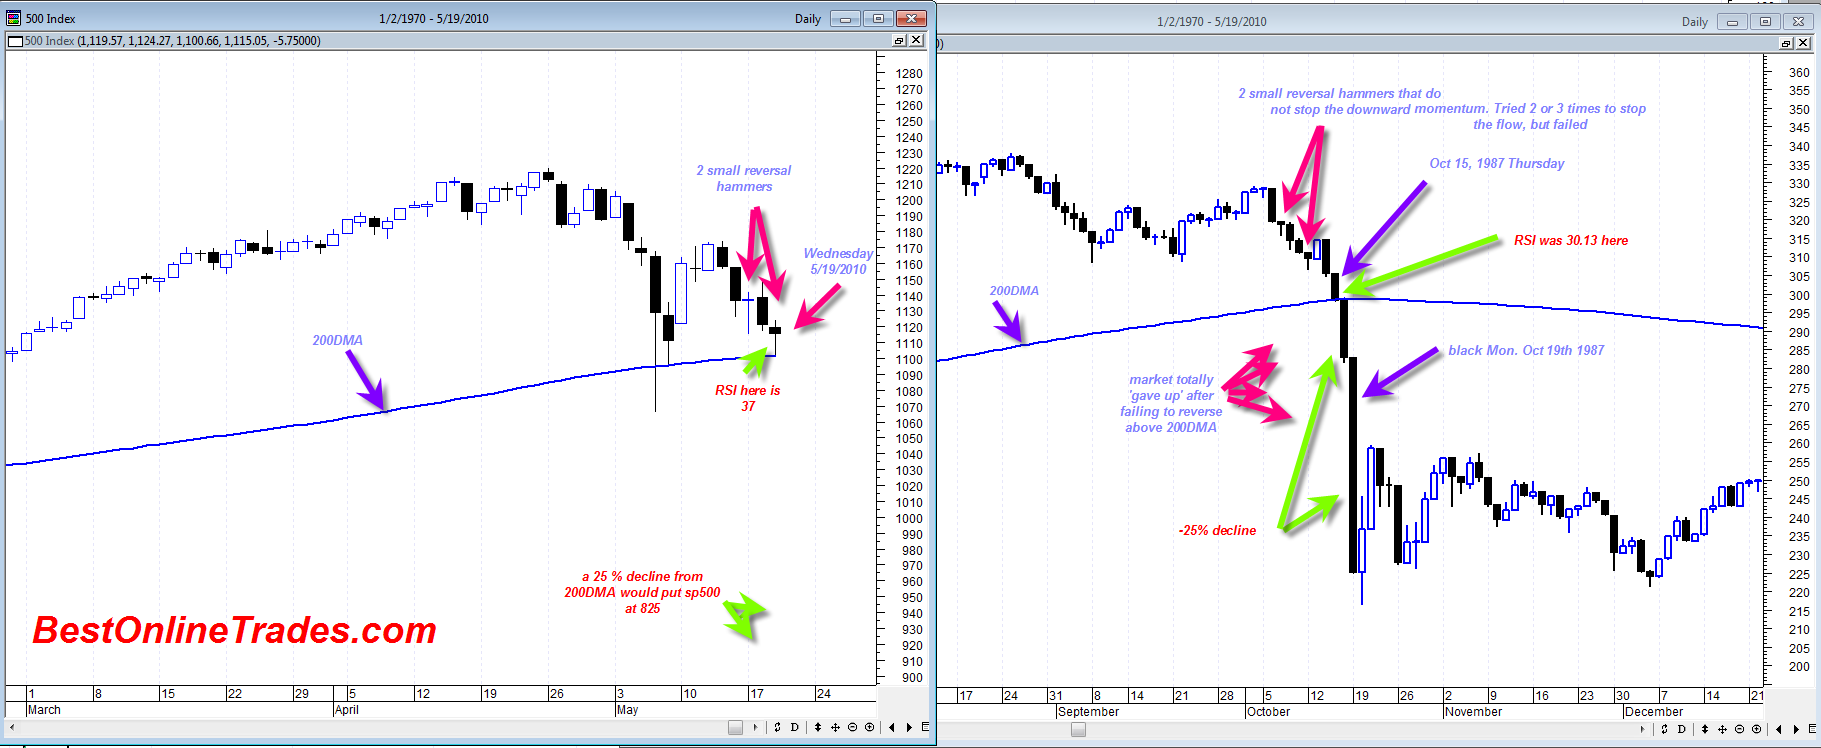
my gut says the intraday low will be on Monday May 24, 2010
P.S. I also just noticed we did a MARIBUZU Candlestick (open is equal to the high and low is equal to the close) on the sp500. wow.
Edited by tradesurfer, 20 May 2010 - 03:10 PM.