I was bullish for next week, now I'm not, though I plan on staying with the hourly.
Sentiment seems bullish now, and the transports are not confirming. I would not be
surprised to see a 500 point pullback from here.

Next week
Started by
CLK
, Feb 18 2012 07:11 PM
8 replies to this topic
#2

bigbud
-

- Traders-Talk User
- 581 posts
Member
#3
dasein
-

- Traders-Talk User
- 7,696 posts
Member
Posted 19 February 2012 - 04:15 AM
Hi, BB, thansk for sharing your charts - a rare pleasure. what pops out to me is:
couldnt you call that drive you have labelled 2 a 3? then what??
in the label butterfly/triangle trap - how much further up can it go and still retain your label?
the DJIA has been weaker than NAS and SPX, any difference in labels for them? if so, which is more indicative?
tia
best,
klh
klh
#4
bigbud
-
- Traders-Talk User
- 581 posts
Member
Posted 19 February 2012 - 06:10 AM
Hi, BB, thansk for sharing your charts - a rare pleasure. what pops out to me is:
couldnt you call that drive you have labelled 2 a 3? then what??
in the label butterfly/triangle trap - how much further up can it go and still retain your label?
the DJIA has been weaker than NAS and SPX, any difference in labels for them? if so, which is more indicative?
tia
Hi dasein
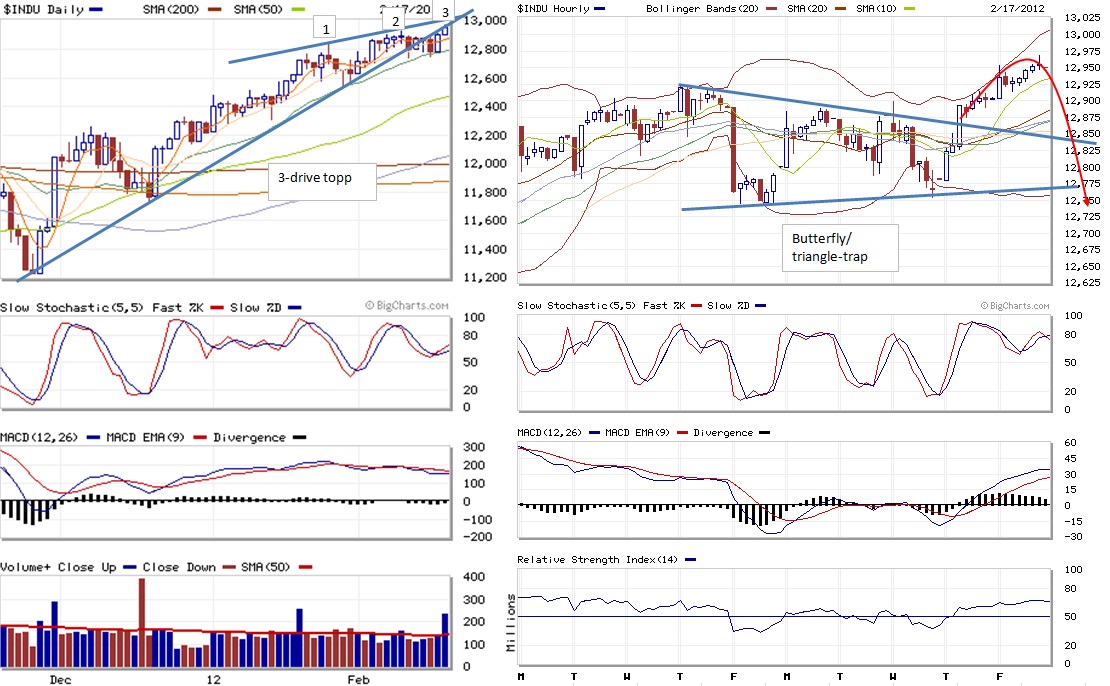
I am not sure I understand what you mean with the 3-drive (my limited english perhaps).
In the 3-drive I look for a top-2 with weaker momentum (not touching the upper trendchannel). Then a break below trendchannel, and a retest of broken trendline (top-3). The top-3 still may have some very limited more upside (13.000 possible) Approx equal spacing between the tops is preferrable.
Further the marked may not break down immediatly after the top-3, and can try to make a final double top-4.
In the butterfly the fake break out from the triangle may extend some ~33% of the range. The range is ~12.925-12.750= 175, giving a potential top of ~13.000.
The DOW has been leading the marked, and was the first major index to test the 2011-highs. So I think the signals in DOW could be leading the this potential top aswell.
BB

Youtube JBCycles
#5
bigbud
-
- Traders-Talk User
- 581 posts
Member
Posted 19 February 2012 - 06:23 AM
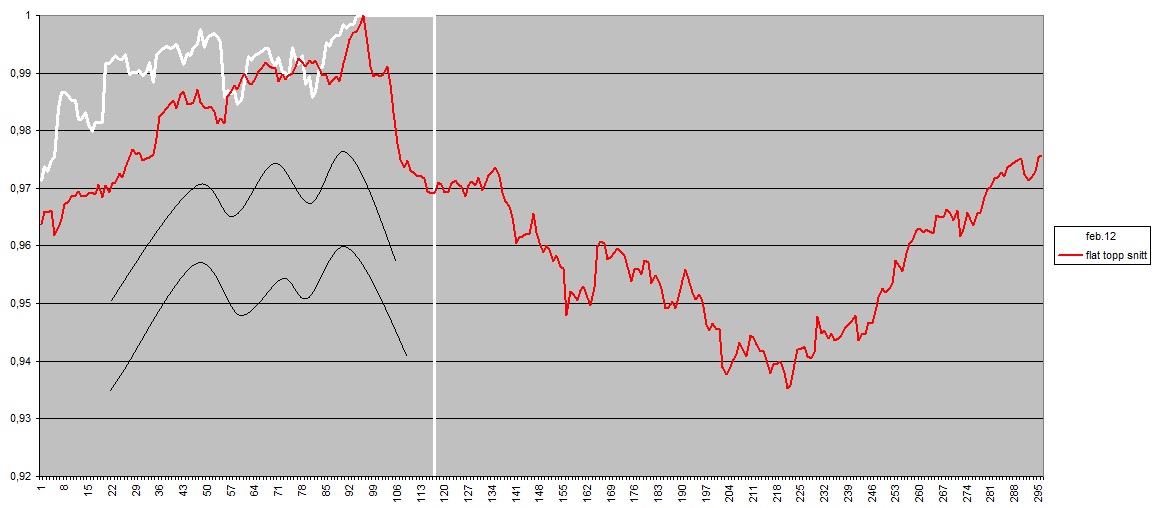
because I am looking for a top, I notice that DOW hourly fits into my scenario for "flat top"
This one normally plays out like a 3-drive or butterfly, and the current DOW fits into the pattern very nicely.
But it requires a breakdown Tuesday-Wednesday
In my momentumindicators the setup looks a bit uncommon. The closest matches are before the flash-crash and August-11 crash.
So IF we begin a correction on Tue-Wed, it MAY be a very very bearish setup...
BB
Edited by bigbud, 19 February 2012 - 06:24 AM.
Youtube JBCycles
#6
Charvo
-

- Traders-Talk User
- 380 posts
Member
Posted 19 February 2012 - 09:46 AM
China reserve ratio reserve cut should be impetus for upside bias in commodities and the Aussie dollar. It could be favorable for equities, too.
#7
andr99
-

- Traders-Talk User
- 8,539 posts
Member
Posted 19 February 2012 - 02:26 PM
because I am looking for a top, I notice that DOW hourly fits into my scenario for "flat top"
This one normally plays out like a 3-drive or butterfly, and the current DOW fits into the pattern very nicely.
But it requires a breakdown Tuesday-Wednesday
In my momentumindicators the setup looks a bit uncommon. The closest matches are before the flash-crash and August-11 crash.
So IF we begin a correction on Tue-Wed, it MAY be a very very bearish setup...
BB
hi bigbud here's a link to a chart of the italian index. It fits well with a drop coming soon. The red line is the italian index (last value on 02/08/2012) while the blue line is the forecast of the future path. Looks like italy will go down
together with the dow.........which is plausible at Tops.
http://elliottgannfo...g.blogspot.com/
Edited by andr99, 19 February 2012 - 02:26 PM.
forever and only a V-E-N-E-T-K-E-N - langbard
#8
bigbud
-
- Traders-Talk User
- 581 posts
Member
Posted 19 February 2012 - 03:06 PM
and hi andr99
How is Italy... still snowy?
My work has a convincing consensus expecting downside
Let my give som examples
-the ~15 week cycle is an obvious one, and it suggests a top right here (from the Dec lows). I have the sell-signal in my SPX momentum about one week ago, and it is still at work... just being stretched. Now, the 15 week cycle is not a real cycle. It just a resonance in this market since 2007, and a multiple of one of the real cycles of ~20TDs
I live in Norway, and do most of my work on our market. And here I find:
-we had an overbought signal about two weeks ago, with a high number of 20/40-day highs, which signals a price-top some 1-2 weeks later. And we are there now
-recent days there has been divergences in the internals, with fewer stocks pulling the market to new highs, and weak breath. It is mostly the liquid bluechips, and a few stock that do wild spikey moves (shortsqueeze)
-We are 42 days above 24MA, and since 2006 it is only the QE2 rally that lasted longer
Now looking at some empirical data, shows that
-when breaking above 200MA and above a declining trendchannel, when 200MA has a negative slope... is a rally ine wants to sell. But let it first go ~10% above the broken trend, and 5-10% above 200MA. On Friday we were up 10%, and 8% above 200MA
-a golden cross 50/200MA is a sell (unless it comes after a long bearmarked), and we had that about 1 weeks ago
So these signals tell that I should expect a top here, and then either
-a 3-4 week correction of ~10%, and then more uptrend
-or a deeper correction and bearmarked
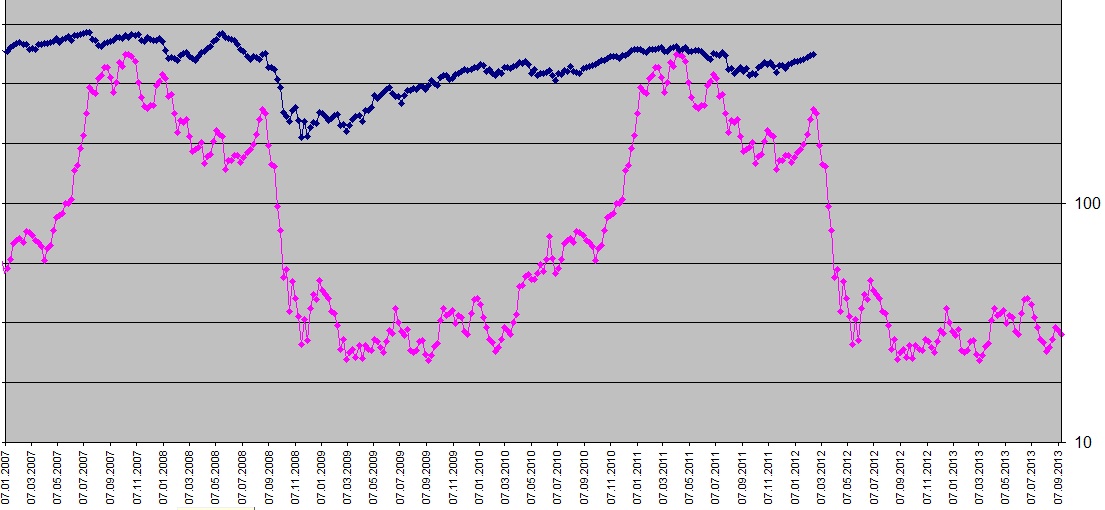
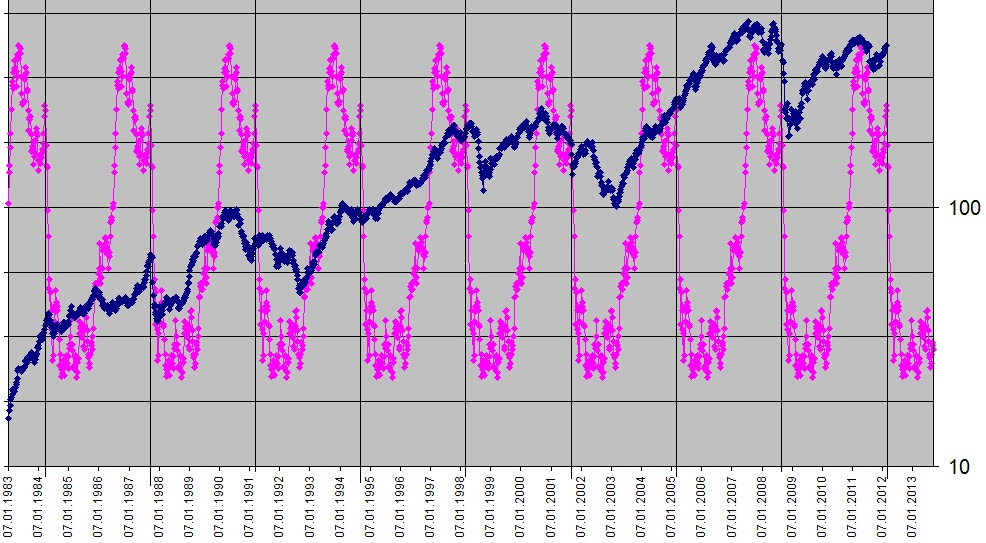
There are many cycles, and an imortant one is the Kitchin cycle. Here it is for Norway, and it screams "stay away". Question is whether the 10 year cycle is up, giving us a sideways marked in 2012, like 1984, 1994 and 2005. We have to wait and see (and not being long when doing so...)
On the bullish side, we have a "real" ~6month cycle that is bullish this winter. However it may fail, just like March 2011 and April 2010.
And the ~20TD cycle is bullish next week... but we had a solar storm tonight and last week... and they should override the cycle.
Further we see a divergence with solar flux, that has been weak since New year http://www.solen.inf...mages/solar.gif
-this doesn´t happen so often... last time I can think of was Sept-Oct 2007
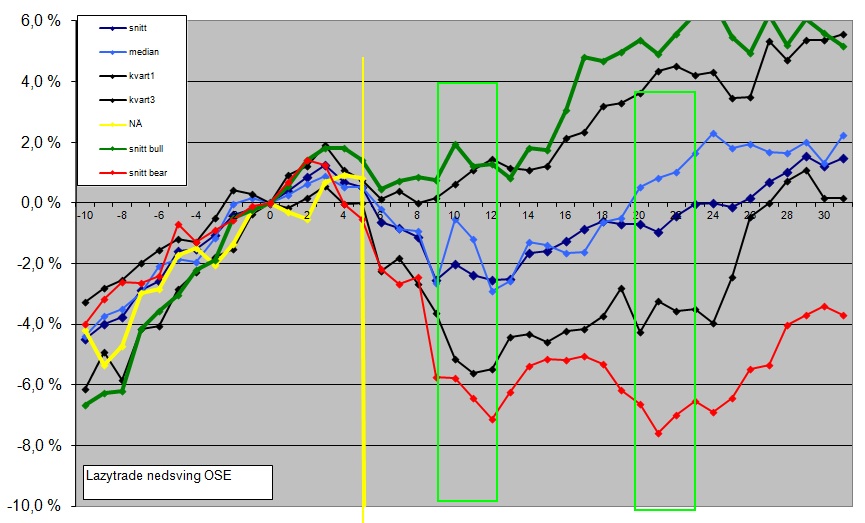
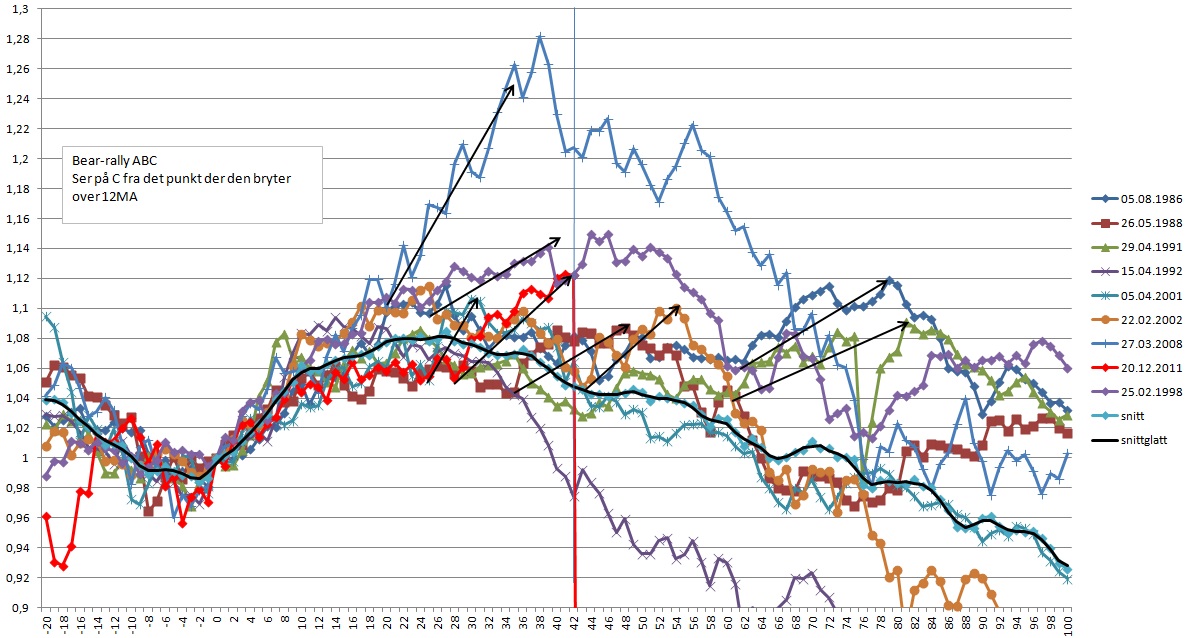
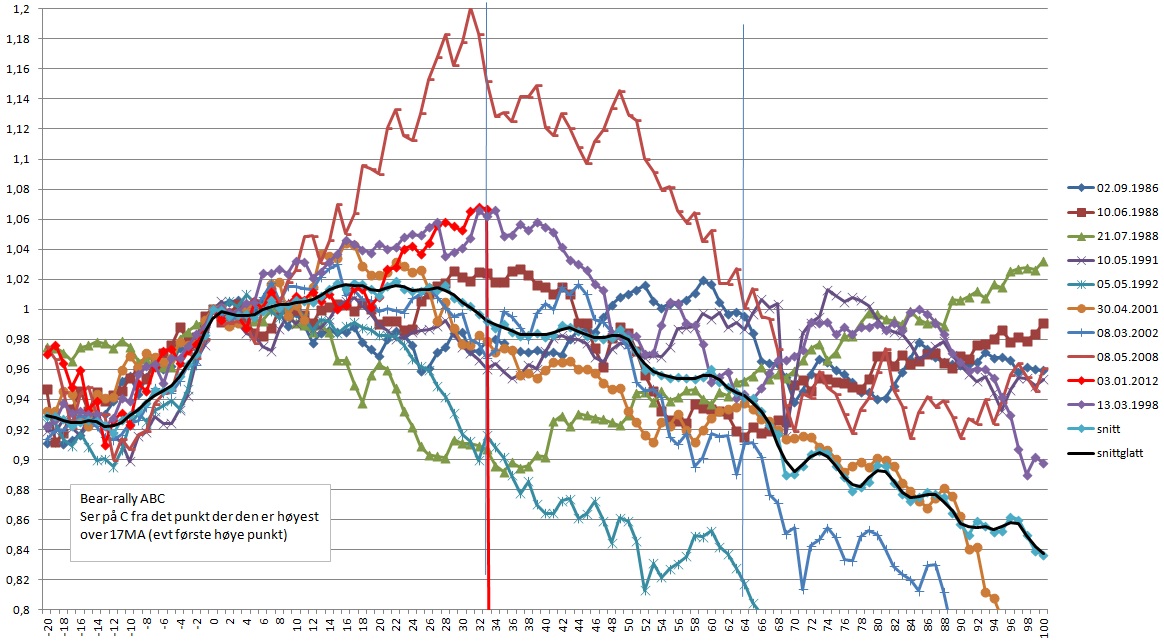
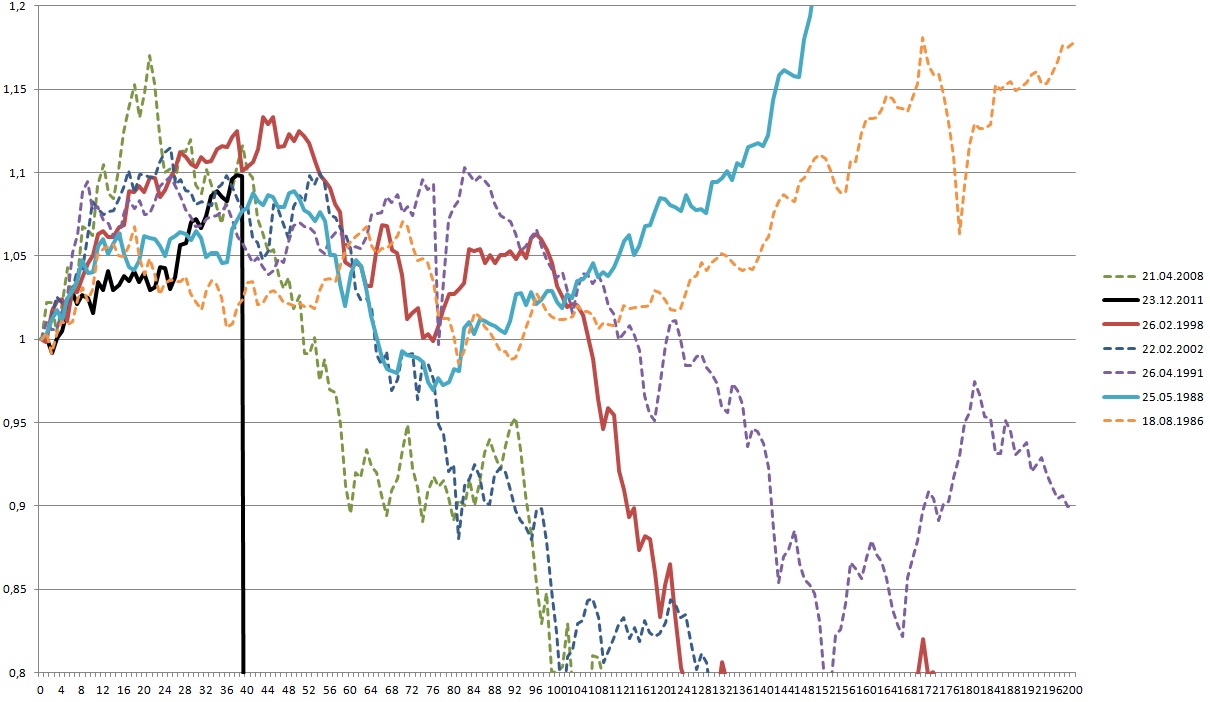
Throwing in some other comparisons I am looking at, without any more comments
How is Italy... still snowy?
My work has a convincing consensus expecting downside
Let my give som examples
-the ~15 week cycle is an obvious one, and it suggests a top right here (from the Dec lows). I have the sell-signal in my SPX momentum about one week ago, and it is still at work... just being stretched. Now, the 15 week cycle is not a real cycle. It just a resonance in this market since 2007, and a multiple of one of the real cycles of ~20TDs
I live in Norway, and do most of my work on our market. And here I find:
-we had an overbought signal about two weeks ago, with a high number of 20/40-day highs, which signals a price-top some 1-2 weeks later. And we are there now
-recent days there has been divergences in the internals, with fewer stocks pulling the market to new highs, and weak breath. It is mostly the liquid bluechips, and a few stock that do wild spikey moves (shortsqueeze)
-We are 42 days above 24MA, and since 2006 it is only the QE2 rally that lasted longer
Now looking at some empirical data, shows that
-when breaking above 200MA and above a declining trendchannel, when 200MA has a negative slope... is a rally ine wants to sell. But let it first go ~10% above the broken trend, and 5-10% above 200MA. On Friday we were up 10%, and 8% above 200MA
-a golden cross 50/200MA is a sell (unless it comes after a long bearmarked), and we had that about 1 weeks ago
So these signals tell that I should expect a top here, and then either
-a 3-4 week correction of ~10%, and then more uptrend
-or a deeper correction and bearmarked
There are many cycles, and an imortant one is the Kitchin cycle. Here it is for Norway, and it screams "stay away". Question is whether the 10 year cycle is up, giving us a sideways marked in 2012, like 1984, 1994 and 2005. We have to wait and see (and not being long when doing so...)
On the bullish side, we have a "real" ~6month cycle that is bullish this winter. However it may fail, just like March 2011 and April 2010.
And the ~20TD cycle is bullish next week... but we had a solar storm tonight and last week... and they should override the cycle.
Further we see a divergence with solar flux, that has been weak since New year http://www.solen.inf...mages/solar.gif
-this doesn´t happen so often... last time I can think of was Sept-Oct 2007
Throwing in some other comparisons I am looking at, without any more comments
Youtube JBCycles
#9
andr99
-
- Traders-Talk User
- 8,539 posts
Member
Posted 19 February 2012 - 04:02 PM
and hi andr99
How is Italy... still snowy?
Rain.....a boring rain. Tomorrow they have said.............it will be snow again, but I don' t think so and hope they are wrong otherwise in rome they will declare the state of calamity and will call the army, the civil protection and the red cross too.....and possibly also will ask for international help. I live in the pre-Alps North Eastern region, so looking from my windows I see the snow on the mountains during the whole winter, but here in the plain it's just a two-three times a year event even though temperatures are many more times below zero. That said....I like your charts..... Thanks for posting them.
Edited by andr99, 19 February 2012 - 04:03 PM.
forever and only a V-E-N-E-T-K-E-N - langbard


