Due to Russell's annual index rebalancing, you're likely seeing very heavy volume at the end of the day. It's done after the bell, but there are usually billions of dollars worth of trades cross the tape at the close. According to Reuters, there were 688 million Nasdaq listed shares worth $9.5 billion crossed the tape in just 1.15 seconds right at 4:00pm.
In 2010 and 2011, the rebalancing was performed on June 25 and June 24, respectively. Neither of those spikes in volume indicates any direct impact on the direction of the market, as far as I'm concerned. Today should be no exception. Thus, notwithstanding the surge in volume today, this looks more like an oversold bounce with just 166 SPX up issues vs. 245 down issues. Meanwhile, today's negative DJIA "Money Flows" of $2.05 billion is the largest since the $2.6 billion negative flow on 5/31/12.
And, I've also just taken a quick look at QQQ since 2000.
Even though the final week of June closed higher 9 out of the past 12 times, the first two days of the week were back-to-back down days 7 out of 12 times. And in 3 of the other 5 years, Tuesday closed lower. Essentially, Tuesdays traded down 10 out of 12 times. Since this is just a visual observation, accuracy's not guaranteed.

DOWN MONDAY & TUESDAY
Started by
TechMan
, Jun 22 2012 07:36 PM
7 replies to this topic
#2

TechMan
-
- Traders-Talk User
- 7,663 posts
Member
Posted 22 June 2012 - 11:00 PM
As I'm going over my closing data, here's another rare incident that only happened 5 times since I started tracking this data set in 2005. This is one of my volume weighted Nasdaq Indicators that had gone into the extreme overbought territory on 6/19/12, peaked on 6/20/12, and started retreating for 2 straight days now.
As you may have noted, during QE1 period, the ensuing mean reversions after 12/10/08 and 7/27/09 peaks were almost non-existent. However, during the non-QE periods, those mean reversions after 7/26/10 and 7/7/11 were quite "dramatic". Assuming, and I really mean assuming, that there are currently no QE influences, domestic or abroad, then what happens from here on should be just as "dramatic".
For those that don't believe in coincidence, this is the 2nd time these "rare events" occurred since my "SPY After Hour" extreme reading last night.
Edited by TechMan, 22 June 2012 - 11:10 PM.
#3
TTrader47
-

- Traders-Talk User
- 517 posts
Member
Posted 23 June 2012 - 01:13 AM
As I'm going over my closing data, here's another rare incident that only happened 5 times since I started tracking this data set in 2005. This is one of my volume weighted Nasdaq Indicators that had gone into the extreme overbought territory on 6/19/12, peaked on 6/20/12, and started retreating for 2 straight days now.
As you may have noted, during QE1 period, the ensuing mean reversions after 12/10/08 and 7/27/09 peaks were almost non-existent. However, during the non-QE periods, those mean reversions after 7/26/10 and 7/7/11 were quite "dramatic". Assuming, and I really mean assuming, that there are currently no QE influences, domestic or abroad, then what happens from here on should be just as "dramatic".
For those that don't believe in coincidence, this is the 2nd time these "rare events" occurred since my "SPY After Hour" extreme reading last night.
Do you think operation twist has any effect on this like the QE's did?
#4
TechMan
-
- Traders-Talk User
- 7,663 posts
Member
Posted 23 June 2012 - 09:06 AM
Do you think operation twist has any effect on this like the QE's did?
If they're really doing the "Twist", then it's negative for the stock market. And, believe me, the Fed knows that. The Fed IS the yield curve.
Look at the yield curve spread between the day of the announcement of the original Operation Twist on 9/21/2011 (OT1) and the recent stock market low on 6/1/2012.

And compare that to the spread between OT1 and the rally off of that 6/1/12 low to the recent stock market peak on 6/19/12.

Edited by TechMan, 23 June 2012 - 09:11 AM.
#5
AChartist
-

- Traders-Talk User
- 5,800 posts
Tim
Posted 23 June 2012 - 11:51 AM
If we do move down on Tues, I'll make some long purchase.
I don't know if it will last to Jul 3 or Jul 27. If it doesn't move
down a lot, I don't want any.
"marxism-lennonism-communism always fails and never worked, because I know
some of them, and they don't work" M.Jordan
#6
bigbud
-

- Traders-Talk User
- 581 posts
Member
Posted 23 June 2012 - 04:43 PM
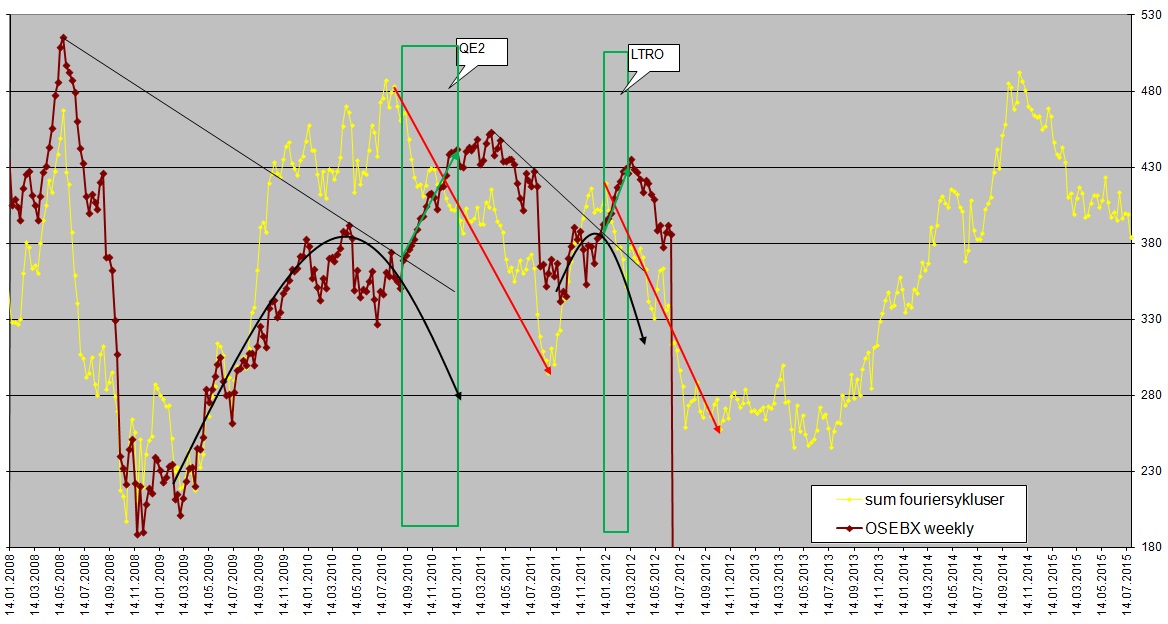
here is what I see in the Norwegian index
-right now we could be in a rally, or it could be a bearmarket bounce. It is undecided so far
-but if we see more weakness in the coming week, it doesnt look like a rally anymore. Doesn´t mean we have to crash right away, but start looking for shorts
-the bounce/flag looks a bit small so far, and normally should try som more to the upside
-normally the ~4 week bear-rallies top at the 50MA and fail down. So far Norway hasn´t tested 50MA
So going up and retest last week high would be fine for a short around 50MA in Norway...
this is btw my fourier composite for Norway. Pointing down to Aug-Oct, and to summer 2013
Youtube JBCycles
#7
Mr Dev
-

- Traders-Talk User
- 11,528 posts
Member
Posted 25 June 2012 - 10:12 AM
although it looked like you were knocking the crash caller..or the call... now seems you can see what may be lurking
around the corner
you now have the right call ... monday is down, so sorry for the early warning post... seems they often bring out the contrarian callers.
around the corner
you now have the right call ... monday is down, so sorry for the early warning post... seems they often bring out the contrarian callers.
Edited by Mr Dev, 25 June 2012 - 10:14 AM.
.. .. ..
Mr Dev
......trading is basically a simple operation, but you have to be a genius to understand the simplicity.
.....timing,..... is ....everything !
... remember no guessing visit MrDev!
#8
TechMan
-
- Traders-Talk User
- 7,663 posts
Member
Posted 25 June 2012 - 11:29 AM
although it looked like you were knocking the crash caller..or the call... now seems you can see what may be lurking
around the corner
you now have the right call ... monday is down, so sorry for the early warning post... seems they often bring out the contrarian callers.
A little passive-aggressive? It's also interesting that you'd hold it till the market sold off to vent it.
Anyways...
(1) 20-point selldoff is not a "crash".
(2) "Lurking" is also not a "crash".
(3) I was merely stating an observation that seems to work every time people started posting "crash" calls.
(4) Even though it makes me feel like some kind of a western shootout every time I post a new thread, this is not a competition for me. I'm only sharing what I'm seeing with the board here. So, I'm not really concerned about whether I've got the "right" call or not.


