................................................................................
.........
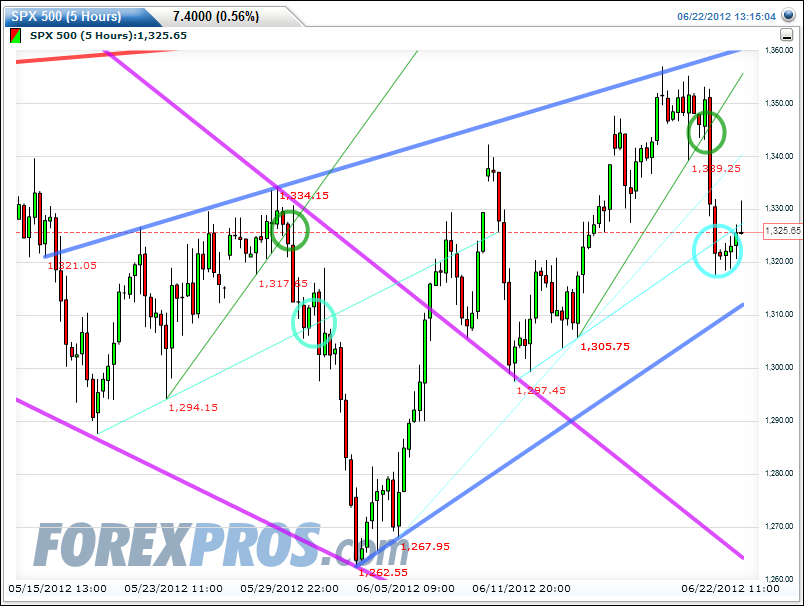
Hi DrSP, sorry late in reply than I'd like to. Had problem with Forexpros charting Sunday, so been only updating my blog, OK now.Thanks, iloli. We are in an ascending wedge since ~ May 10th or so.
#1 ---Since ascending wedges can break lower, frequently at ~ 2/3 rds of the wedge,
#2 ---is it possible that we are going sharply below 1310 this time?
#3 ---What would be a confirmation that below 1310 scenario is off the table?
I trade between lines that I can pre draw per evidence provided by price. BO/ BD is only head and tail, the continuation is the middle part of the fish. Even tho I don't ask myself the same questions as you do (therefore I think I can't give you answers that you'll be satisfy with), but I do have answers derived from using my LOL methods for each of your questions.
#1 --- I know you did not post a question here, but my BD target for Dark Blue Rising Wedge is 1271.
#2 --- Yes possible. If you'd followed my work (sometimes I have to work hard to follow my own lol!) the top of the last Red Sickle 1334 has to hold in order to go new high over Mar/May's. We lost 1334 now, so the 5/6 four downside targets and 1288, 1276, 1262 all possible.
#3 --- Needs to rebound hard and strong from 1310, more precisely, rebound hard from the lower TL of rising wedge posted last Thursday. As I type this now, 1310 already long gone (a day is too long for VST swing), so forget it...
Let me go back to track down my last 'lockstep' chart, and use that to find what's next in shop to step on, see if you guys can make sense out of.
Connecting to last chart is this Friday's chart: Now with room to insert, I am sure you can see what I meant about those circled junctures compatible to each own sets of Thin Green and Light Blue parallel lines.
Also last Friday's chart: We can see clearly in this chart, the IH&S is still alive and kicking. The two downward arrows pointing a "Complex Head" on a newer red shoulder line. If you compare this to that previous IH&S BO'ed chart. This chart answering why that BO might not have happened, due to the additional price movements since.
We COULD see at least two more 'allowable' touches on Neckline to come before a BO again, similar to that on the left side of Neckline marked in 3 small Blue Squares; though not necessary at all. It could be also one big rush BO of Neckline too, or none if down from here.
But, as long as the Green Shoulder-line continue to support; and the lows of Head continue to hold up, in process of doing so, not causing the head too ridiculous out of shape; and the right shoulder not extended too wide; then, BO probability of the Neckline remains high. It better be... with all these restrictions required, right? LOL!
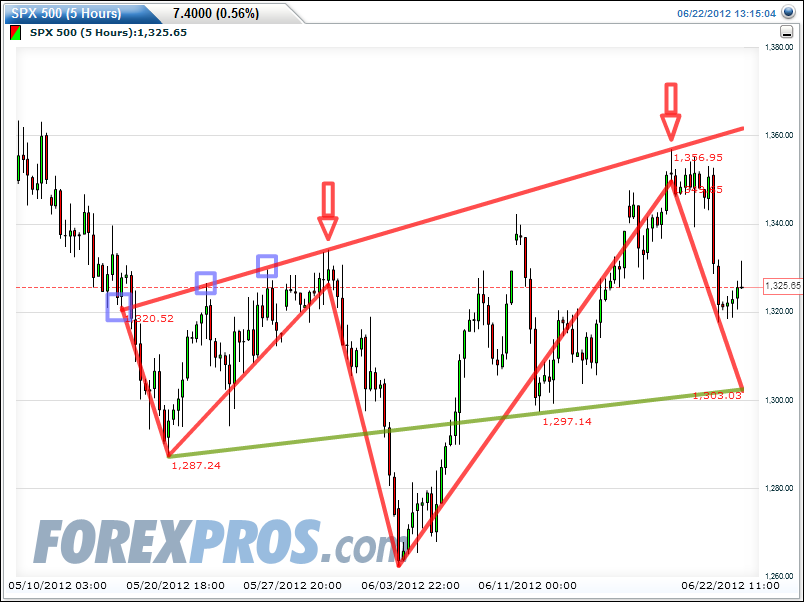
Now.... cooked out exactly as the recipe said, the two sets of circled juncture breakdown almost identical. Blue Rising Wedge broke down but price saved by intervening of the interacting pattern - Complex Inverted H&S. So we bounced from the Green Shoulderline at EOD, with no surprise right on that line just like I showed in Friday's chart.