http://stockcharts.com/c-sc/sc?s=$VLE&p=D&yr=1&mn=6&dy=0&i=p99276184246&a=272623393&r=1343543307653.png

VLE does not confirm SPX breakout
Started by
Echo
, Jul 29 2012 01:30 AM
6 replies to this topic
#2

selecto
-

- Traders-Talk User
- 6,871 posts
Member
Posted 29 July 2012 - 08:47 AM
Doc, I can't draw a SPX breakout yet:

http://stockcharts.com/c-sc/sc?s=$SPX&p=D&yr=0&mn=6&dy=0&i=p94680771217&a=273130061&r=1343569509510.png
http://stockcharts.com/c-sc/sc?s=$SPX&p=D&yr=0&mn=6&dy=0&i=p94680771217&a=273130061&r=1343569509510.png
#3
IYB
-

- TT Patron+
- 7,157 posts
Member
Posted 29 July 2012 - 12:57 PM
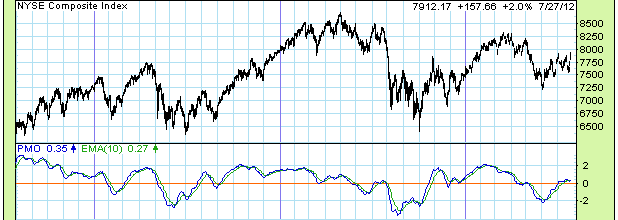
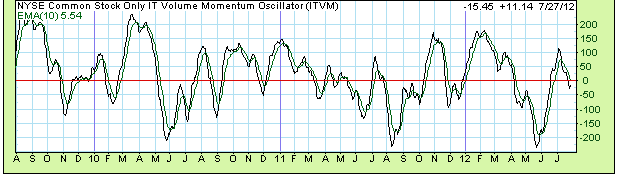
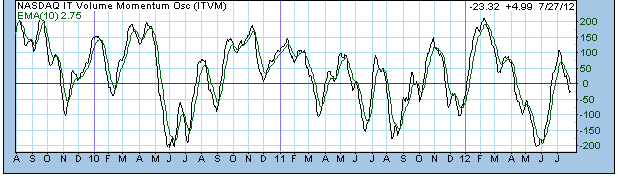
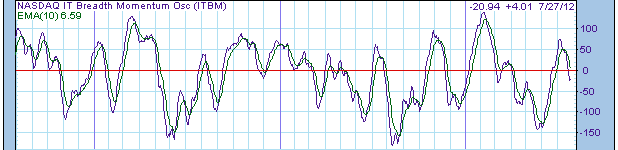
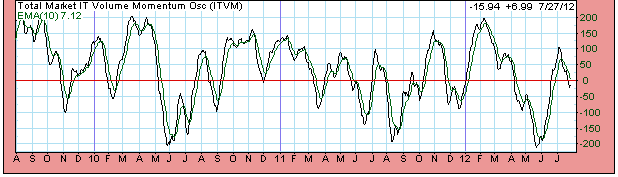
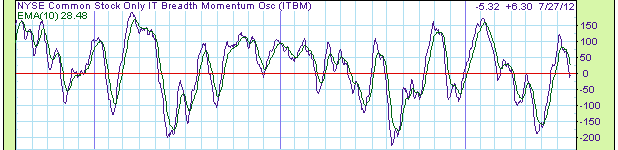
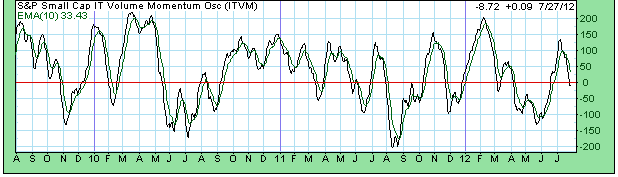
There are a whole lot of "internals" that are not confirming this new SPX high (whether we call it "breakout" or not), not the least of which are the NYSE advance-decline line and ALL of the Intermediate Term Breadth Momentum and Volume Momentum indicators at Decision Point. For the record my IT and ST trend indictors are on uptrend mode and I've been trading long for actively managed trading accounts, but for the Intermediate Term Position account, I'm went to cash at the early July ST peak and am staying very cautious unless or until internals confirm:


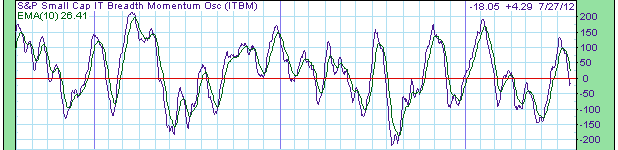

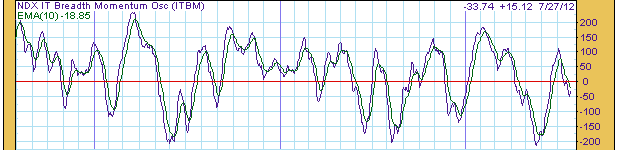
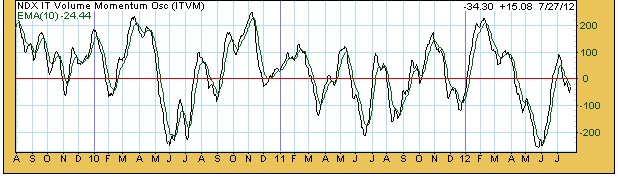
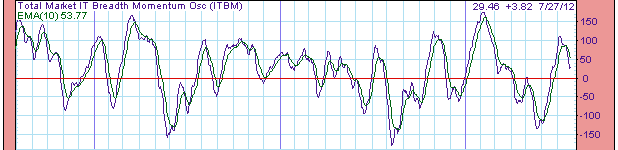
Attached Thumbnails

Edited by IYB, 29 July 2012 - 12:59 PM.
Men, it has been well said, think in herds; it will be seen that they go mad in herds, while they only recover their senses slowly, one by one. ― Charles Mackay, Extraordinary Popular Delusions and the Madness of Crowds
#4
Echo
-
- Traders-Talk User
- 2,273 posts
Member
Posted 29 July 2012 - 02:51 PM
D, Very nice reminders. thanks for the charts.
#5
Geomean
-

- Traders-Talk User
- 1,177 posts
Member
Posted 29 July 2012 - 03:05 PM
Echo, THX, and ditto the charts of the $Compx, $RUT, and $NDX, vis a vis Value line index.
Geo
Opportunity knocks on your door every day-answer it.
#6
Echo
-
- Traders-Talk User
- 2,273 posts
Member
Posted 29 July 2012 - 03:36 PM
thx Geo. Enjoy your charts as well though your interpertation is needed for the complicated Demark analysis and terminology. Always appreciate your input.
Selecto, agree on your chart, mine is closing only basis, a preference of some technicians (not necessarily me though). I post for interest only. Also on closing only basis, SPX stopped dead on Friday at a key Fib retracement, the 76.4% (seen on my chart as the inverse 23.6% as SC doesn't do us the favor of including the 76.4%!) Geo, you will like this one as well I imagine.
Doc
http://stockcharts.com/c-sc/sc?s=$SPX&p=D&yr=0&mn=6&dy=0&i=t84946912730&a=204296642&r=1343593944660.png
#7
ogm
-

- Traders-Talk User
- 13,780 posts
Member
Posted 30 July 2012 - 07:27 AM
Nice charts.
So far the only index has has made a clear breakout with strong bullish posture is the DOW. The narrowest large cap index, full of dividend paying , "safe" stocks.
Its pretty typical of the last stages of the bull market for the A/D line to start shrinking, as only the safest bets are being made.
Its not a fact yet that the bull market is over, however. I'm not ready to pull that trigger yet, even though I've been waiting and hoping for a while  My biggest fear however is that this will not turn into any clear bull/bear market for quite some time.
My biggest fear however is that this will not turn into any clear bull/bear market for quite some time.


