Jump to content


Photo

Gold


  • Please log in to reply
3 replies to this topic

#1 fib_1618

fib_1618

    Member

  • Traders-Talk User
  • 10,301 posts

Posted 27 October 2012 - 02:18 PM

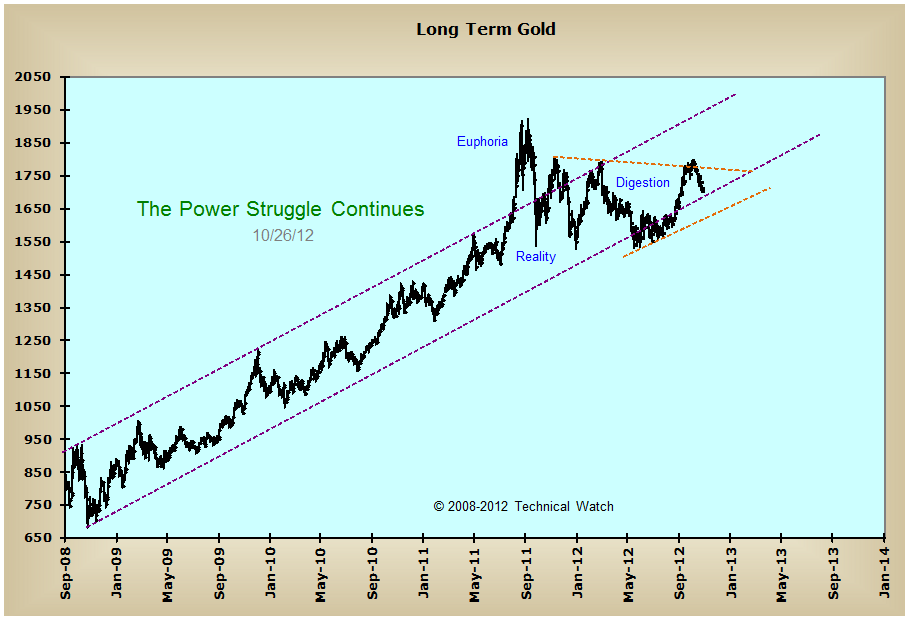
A longer term perspective showing the ongoing interplay between the 4 year uptrend and the triangular pause of this trend that was created after an euphoric "overthrow" top in the yellow metal during the summer of 2011.

As the chart shows, the next several weeks should provide the answers as to whether the late summer rally of this year was the start of another sequence higher by holding trend line support, or was it a rally failure to where a significant topping structure is now in place.

Stay tuned.

Fib

Posted Image

Better to ignore me than abhor me.

“Wise men don't need advice. Fools won't take it” - Benjamin Franklin


"Beware of false knowledge; it is more dangerous than ignorance" - George Bernard Shaw


Demagogue: A leader who makes use of popular prejudices, false claims and promises in order to gain power.


#2 dougie

dougie

    Member

  • Traders-Talk User
  • 10,004 posts

Posted 28 October 2012 - 04:55 PM

at the very least, is suspect sometime in the next 6 months or so, that latter theory will be severly suggested THANKS

#3 Alton

Alton

    Member

  • TT Member+
  • 210 posts

Posted 29 October 2012 - 11:01 AM

Second time I've succumbed to redrawing one of Fib's charts, and his labels can apply here. This is the GLD etf rather than spot. Log scale suggests a slightly different positioning of the channel, and I've included a couple of additional lines. But the premise remains the same, and the possibilities don't need any elaboration from me. -- Alton GLDwk20121026LogAlt.gif

Edited by Alton, 29 October 2012 - 11:06 AM.


#4 dharma

dharma

    Member

  • Traders-Talk User
  • 9,912 posts

Posted 29 October 2012 - 11:04 AM

just for clarification, so are you saying a pullback here means the final top is in place? thanks dharma