

Special Note: This July marks the 31st anniversary of our publication. As has been our custom for the past 31 years, our lowest subscription rates and renewal rates are offered throughout the month of July when we heavily discount subscription rates. That will remain our policy this year. Those whose subscriptions expire at different times of the year are welcome to renew at the special price and we will simply add the renewal period after the point of expiration of your subscription. All are welcome to add on up to five years to their subscriptions to protect against possible future price increases. This is an appropriate time to express our thanks for the support we receive from virtually all our subscribers. We consider the writing of our newsletter to be a continuing learning experience for ourselves and we hope for our subscribers. The discount prices are:
—THE CYCLES—
The year 2006 is scheduled to be both a 4 year and an 8 year cycle bottom for the stock market. Sometime this fall, perhaps extending into early 2007, the stock market should form a bottom of some importance that is scheduled to lead to the strongest market advance of the past several years. If we consider the cycle to be eight years long, the preceding bottoms of this cycle occurred in 1998, 1990, 1982, 1974, 1966, 1958, 1950, and 1942. Let’s examine those cycles and their subsequent resolutions in more detail. If you have a sense of market history, you will recognize most of the years just given as starting points of historically important market bottoms.
All of them as the starting point of historically important market advances. The chart above is a monthly closing price chart of the Dow Jones Industrial Average since its very major bottom in April 1942. The vertical lines mark the exact lows of the eight year cycle beginning with the bottom in April 1942. The dates at the bottom of the chart are used as guidelines and although several them mark the exact months of 8 year cycle bottoms, that is not the case with all the dates. For example, the bottom in 1966 occurred in October, not in May. Used the date labels as guidelines only. The first thing to notice is that midway between each eight year cycle resolution, with the exception of the 1942-1950 period, another important low occurs, namely the bottom of a 4 year cycle.
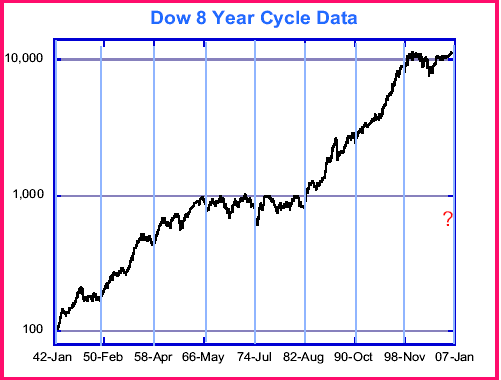
We would contend that the price differential between an 8 year cycle bottom and the 4 year cycle bottom that follow gives us an excellent interpretation of the position of longer term cycles-cycles longer than eight years. Notice that the 4 year cycle bottom between the 1950 and 1958 idealized 8 year cycle is significantly higher than the preceding 4 year/8 year cycle.
The implication is that longer term cycles continued to press strongly upwards. Indeed, the high of the next four year cycle prior to the October 1957 resolution (ideally due in 1958) moves significantly higher than the preceding 4 year cycle top. The same basic pattern applies between the eight year cycle lows ideally due in 1958 and 1966. The intervening 4 year cycle low in 1962 is significantly higher than the preceding 4 year/8 year cycle bottom in 1958 and the following 4 year cycle peak prior to the 1966 cycle bottom is significantly higher than the preceding 4 year cycle peak that occurred prior to the 1962 bottom of the 4 year cycle.
Now watch this! The intervening 4 year cycle between the 1966 and 1974 bottoms of the eight year cycle is actually lower than the preceding 4 year/8 year cycle low in 1966. That should have been a strong clue at that time that cycles longer than eight years were exerting a downward influence on stock prices. Indeed, the peak of the next four year cycle that occurred in January 1973 was a paltry 7% higher than the preceding 4 year cycle peak prior to the 4 year cycle low in 1970. That was another clue that longer term cycles remained in a downward phase.
Let’s examine the next eight year span. Although the intervening 4 year cycle scheduled for 1978 was indeed higher than preceding 1974 bottom of the 4 year/8 year cycle, the subsequent 4 year cycle high in 1981 barely made it back to the price level of the preceding 4 year cycle top in 1976. By August 1982, there had been 5 peaks of four year cycles, February 1966, December 1968, January 1973, September 1976, and April 1981, and none of them was able to convincingly surpass the preceding four year peak.
By late 1982-early 1983, however, it became clear that some much longer term cycle bottoms had been resolved. Some analysts noticed this earlier than others. We believe it was our study of longer term cycles that enabled us to predict in our October 8th, 1982 newsletter that there was a better than 50 percent chance that the low Dow price of 891-892 seen just one week earlier on September 30th-October 1st “could well be the lowest point to be seen on the Dow Industrials in this generation, possibly our lifetime. What is our justification for such a brash statement? First, remember that we have just seen over the past two-three years what could be interpreted as major bottoms of 20, 30, and 60 year cycles...”
Within two months of that quote the Dow Jones Industrial Average had moved to a new all-time high for the first time in 16 years and the pattern of 4 year/8 year cycles established from 1942 to 1966 began anew. The 4 year cycle bottom between the 1982 and 1990 8 year cycle lows was significantly higher than the preceding 1982 bottom and the same was true once again with the 1994 bottom of the 4 year cycle between the 1990 and 1998 bottoms of the eight year cycle. Those higher intervening 4 year cycle bottoms were strongly suggesting once again that cycles longer than eight years indeed continued to contribute underlying strength to the shorter cycles.
Let’s now proceed to the last segment on the front page chart, namely the 1998-2006 bottoms of the 8 year cycle. In 2002, for the first time since 1970, the intervening 4 year cycle between 8 year cycle bottoms moved down to the same level as the preceding 4 year/ 8 year cycle lows. The 1998 low on the Dow Industrials was 7,379.70. The 2002 low was 7,197.49. It was the first time in 32 years that an intervening 4 year cycle low penetrated the low of the preceding eight year cycle. The story that the longer term cycles were delivering was that they had turned down once again and were not only not contributing to the market’s upside fortunes but had actually started leaning downward. Now that we are approaching the end of a 45 month period since the last 4 year cycle bottom in October 2002, it is also becoming clear that the 4 year cycle peak following the 2002 low could well be lower than the preceding 4 year cycle peak. We say “could well be lower” rather than “was lower” because as we go to press the Dow is a mere 4.6% away from its all-time highs established at the previous 4 year cycle peak.
The fact that time is quickly running out for the possibility of a new all-time high on the Dow suggests that even if there is a last ditch fling to a new all-time high, it will be a token new high at best. This failure of the 4 year cycle peak to register a significantly higher high than the preceding peak is another strong indication that the combined influence of cycles longer than eight years continues to the downside and could, in fact, begin to exert even more downside pressure. The extent of the next decline into a 4 year cycle bottom should provide us with excellent evidence of the strength of the underlying cycles longer than eight years.
—TECHNICAL INDICATORS—
[Reserved for Subscribers]
—MARKET PROJECTIONS—
[Reserved for Subscribers]
—MUTUAL FUNDS—
Rydex switchers bought the Rydex Inverse Dynamic S&P 500 Fund (formerly called the Tempest Fund) on June 8th at the morning price of 40.44. It was sold on June 26th at the close at 40.30 for a loss of 0.3% on the trade. Currently all mutual-fund switchers are in 100% cash positions. We have two different specific model portfolios-one for Fidelity Select switchers and one for Rydex Group switchers. How you distribute your own portfolio is up to you as an individual.
“Stockmarket Cycles” is published the first Friday of the month by Peter G. Eliades. Information is gathered as carefully as possible, but no guarantee can be made as to the accuracy of text or charts. The analysis of stock market cycles is more an art than a science. No guarantee can be made that recommendations will be profitable or will not result in losses. This subscription will not be eassigned without the consent of the subscriber. All information contained herein and given on the telephone update may not be reproduced or rebroadcast in any form whatsoever without the written consent of Peter G. Eliades.
Read more About Peter Eliades and Stock Market Cycles by clicking here.


