Monday July 10, 2006
The index markets seesawed in the initial wake of the employment report as traders bid the market higher on the much weaker than anticipated headline reading of +121,000 new jobs created. However, the reality of a weakening economy began to quickly sink into the near term outlook for many traders. That near term outlook will be highlighted by the next few weeks of quarterly earnings. The biggest shot fired across the bow on Friday was the flat out awful guidance offered by MMM. The stock, which is economically sensitive, dropped significantly on their earnings warning. The key question facing the marketplace right now is simple...will this be a sign of things to come during earnings season? So far this morning, EMC has reported a minor miss in earnings and is called to open a bit lower...in addition, IBM was downgraded this morning and is called slightly lower.
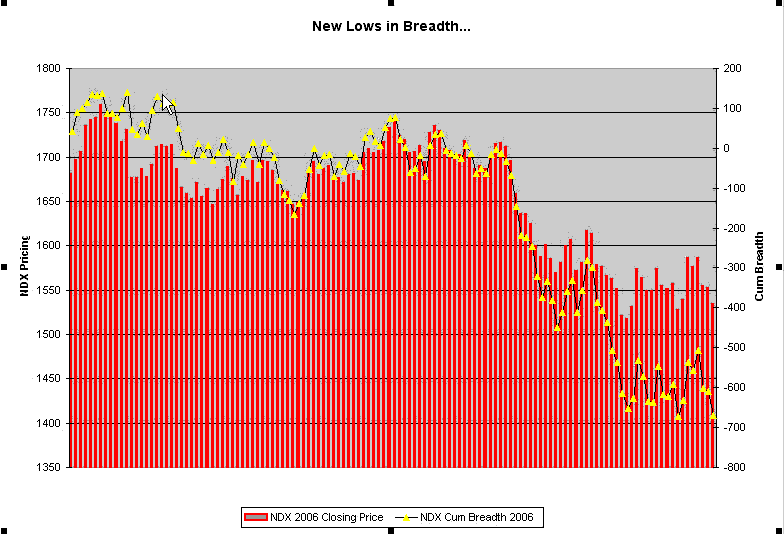
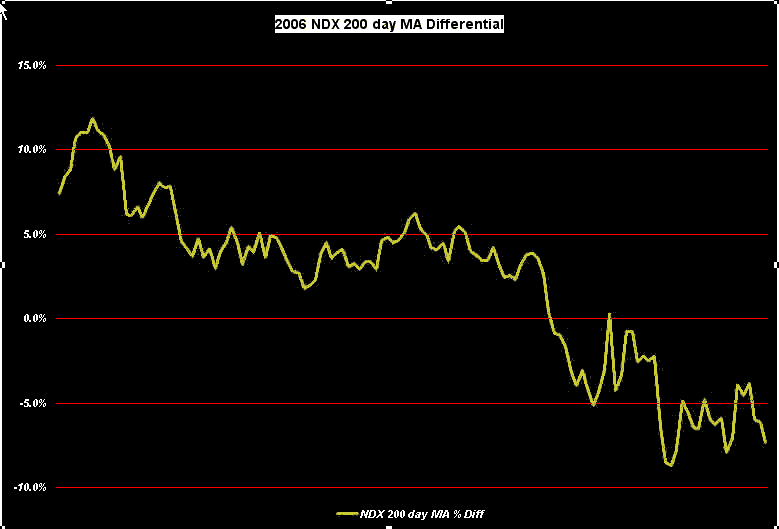
Technically speaking, the indicies are at key levels with the Midcap 400, SPX and Russell 2000 all back at their respective 200 day moving averages after Friday's decline. The DJIA remains moderately higher (+1.5%) from its 200 day, but the counterpoint in the index world right now remains the NDX. Currently, the NDX stands -7.4% below its 200 day MA. In addition, the cumulative breadth for 2006 made a new trading low on Friday's close. Further, the index stands only +1% above the yearly low made in June. Critical support for the index is found a few shades below 1500, further if the index closes below 1515 it will mark the first index to close below their October 2005 lows. The key question facing the indices with relation to the NDX is whether or not this decline will lead to overall index liquidation? If the answer is yes, the SPX has a strong chance to trade down towards the 1185 to 1160 level in 2006 before the washout is complete.
Today's action should be generated on any follow selling from Friday's sharp afternoon decline. The SPU is called to open about +3.00, and +4.50 to Fair Value. The Nikkei staged a strong reversal, opening -1.5% lower and finishing +1.6% higher by the end of the session. However, much of that buying was in response to stronger than expected economic data in Japan released mid-day. It would be a stretch to think this will carry into the U.S. market. Europe continues its world cup celebration hangover and is trading in extremely light volume. However, the European markets have bounced off their respective lows and moderately higher into our open. Finally, the commodity markets continue to add on their declines from Friday. Crude, Gold and other metals are all trading to the downside.
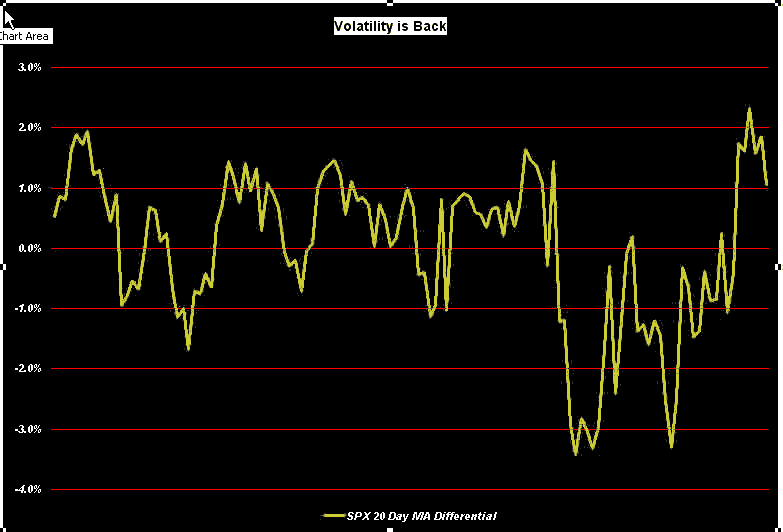
Finally, I have included a few charts, the first one showing the NDX and its cumulative breadth for 2006 long with closing prices for the index. Second is a chart of the 200 day MA differential reading between the NDX cash and the MA. Lastly, I have included a 20 day MA differential chart for the SPX...note the continued uptick in volatility for this reading after such a calm first few months. At the end of the day I think these readings continue to show volatility on the rise.