

"Timer Digest" has Tim Ord ranked #5 for one year ending 6/3/05 and #1 in Gold for one year ending 1/13/06.
For 30 to 90 days horizon: Long Nasdaq on 6/28 at 2111.84. Long SPX on 6/29 at 1272.87.
Monitoring purposes XAU: Long XAU, 129.56 on 12/29/05.
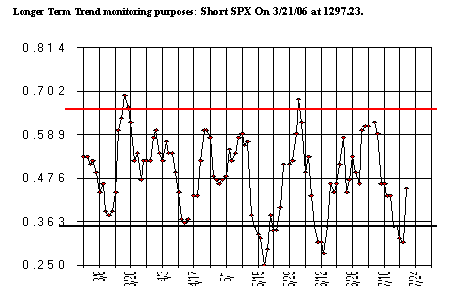
Longer Term Trend monitoring purposes: Short SPX On 3/21/06 at 1297.23.
We have "800" phone update that cost $2.00 a min. and billed to a credit card. Call (1-970-224-3981) for sign up. We update Eastern time at 9:45; 3:15 and 4:00. Question? Call me (402) 486-0362.
What to expect now:
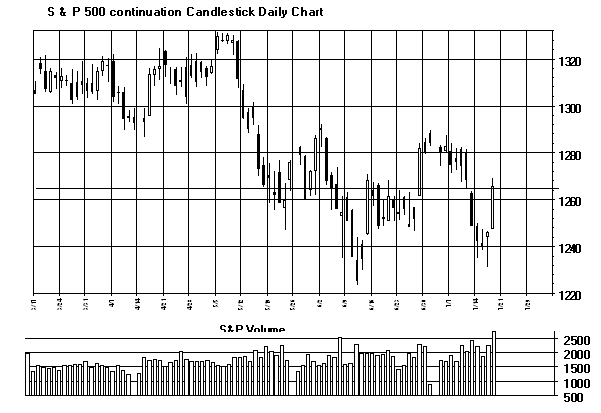
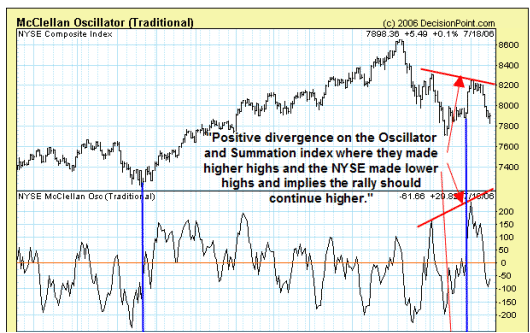
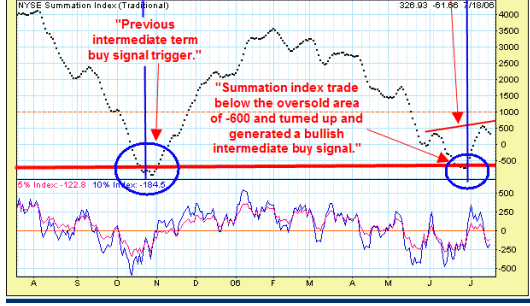
The NYSE chart with its McClellan Oscillator and Summation index is displayed below, courtesy of www.decisionpoint.com. . The NYSE has made Positive Divergence on the McClellan Oscillator and Summation index on the rally into early July. Notice the rally into early July, the Oscillator and Summation index made higher highs and the NYSE made a lower high. This condition implies that the rally phase should continue higher because there where more issues carrying the rally into the early July high. Once the NYSE makes higher highs and the Oscillator and Summation index makes lower highs that the rally phase will be coming to and end. The current condition on the Oscillator and Summation index is bullish and the NYSE in general should move higher for the near term. .The SPX could attempt to test the previous high near the 1325 range before the next declining phase begins Long SPX on 6/29 at 1272.87. Bought GNBT at 1.74 on 7/10/06, biotech.
Bought Ivan (Invanhoe Energy) 4/13/06 at 2.55. Energy stock. Could go to Gap area (November 2003) near 5.40. We Bought ASTM at 1.92 on April 3. Biotech group.
To learn more on "Ord-Volume" visit www.ord-oracle.com.
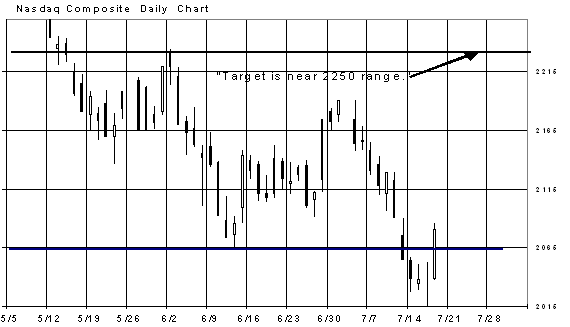
Nasdaq Composite:
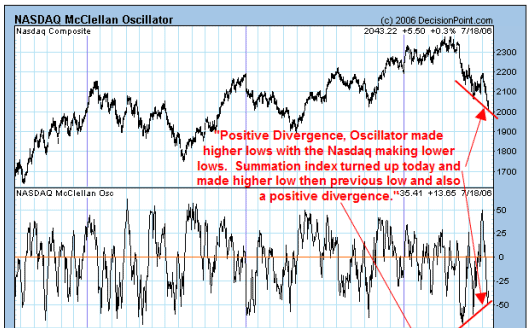
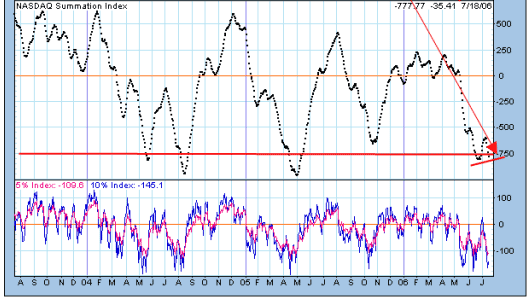
Below is displayed the Nasdaq daily chart with its McClellan Oscillator and Summation index, www.decisionpont.com. Intermediate term lows form on the Nasdaq when the Summation index trades below -750 and turns up. Notice on the June and current low the Nasdaq reached into the -750 range. The chart shown does not have todays data, but todays Summation index reading did turn up and has generated a bullish signal. The Nasdaq has made Positive Divergence on the McClellan Oscillator going into the June and July lows. Notice on the chart that as the June low was approached, the Oscillator made higher lows then the previous low and Nasdaq made a lower low then the previous low. This condition shows that few stocks were participating on the decline to new short term lows and a bullish sign. A similar situation occurred going into the current low. These types of condition are bullish and foretell a rally phase is about to begin. We are still expecting the 2250 range to be tested before the next decline begins. Covered Short position on Nasdaq for 8.4% gain on 6/12 and we are long on 6/28 at 2111.84.
"Timer Digest" has ranked Tim Ord as the #1 gold for one year ending 1/13/06.
Gold Market:
Long BGO (4/19/05) at 2.37. This trade is separate from our long-term position in BGO. We bought PMU (5/27/05) at .50 and bring our average price to .81. Long TRE at 2.55 on 11/1/05, sold at 3.39 on 12/3/05 for 33% gain. Long DROOY at 1.27 on 11/9/05, sold at 1.89 on 1/19/06 for 49% gain. Bought AGT at .33 on 2/1/06, sold at .66 for 100% gain. Long TRE at 6.84 on 3/6/06. Bought GRZ at 6.30 on 5/19/06.
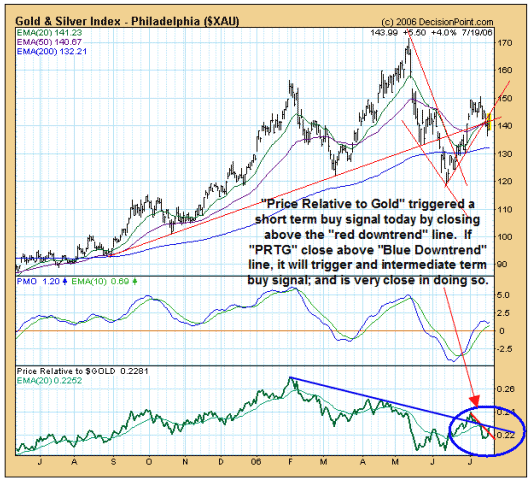
The XAU and Price Relative to Gold ratio charts is displayed below, courtesy of www.decisionpoint.com. Today Price Relative to Gold triggered a short term buy signal by closing above the Red Downtrend line, which implies the XAU should continue to rally. If the Price Relative to Gold closes above Blue downtrend line, it will trigger and intermediate term buy signal and would imply the next major move up is beginning. Notice on the Price Relative to Gold chart that it is very close of closing above the Blue Downtrend line. We are expecting the major trend on the XAU to reach 250.
We are watching VGZ (gold Issues) for possible buy on any pullback to support. We bought TGB at 1.84 on 3/27 by intraday email report. We bought TRE on 3/6 at 6.84 by intraday email report. We double our positions in BGO on (7/30/04) at 2.34 and we now have an average price at 2.70. Long NXG average of 2.26. We bought PMU (5/27/05) at .50 and bring our average price to .81.
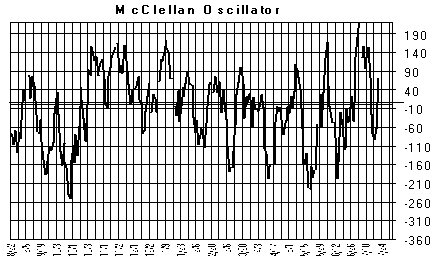
The McClellan Oscillator closed today at +70 and neutral.
The Percent Volume Indicator closed .45 and in the neutral area.
The "5 day ARMS" closed today at 6.04 and short term bullish.
Conclusion: Long Nasdaq on 6/28 at 2111.84. Long SPX on 6/29 at 1272.87
Longer Term Trend monitoring purposes: Short SPX On 3/21/06 at 1297.23.
About Tim Ord and The Ord Oracle


